This page gives an insight into the Wind Data Page of the Borth & Ynyslas Weather Station. It is intended to give those curious about registering an idea of the data they can get access to and to provide an explanation of the various data parameters and charts shown on the page. Subscribers to the Weather Station have full access to this and many other pages with live data updated every minute. You can see samples of the full list of pages available here.
Wind Data from Borth and Ynyslas.
As with most pages of the Weather Station, the Wind Data page is divided into the following sections:
- Current Conditions
- Trends
- Extremes / Records
There are also a few other miscellaneous bits of information that may be of interest. I’ll explain each section in more detail below.
The Data is recorded by The Borth and Ynyslas Weather Station based at Ynyslas approximately 200m East from the Mean High Water Mark at 52º 31’04″N, 4º 03’06″W.
The anemometer includes both wind speed and wind direction sensors and has been wind-tunnel tested to speeds in excess of 170 mph. The sensors are mounted on a telegraph pole 6m above the ground in as exposed a position as is practically possible.
The anemometer has a range of 2 to 130 knots and a resolution of 1 knot. Readings are updated every 2.5 seconds
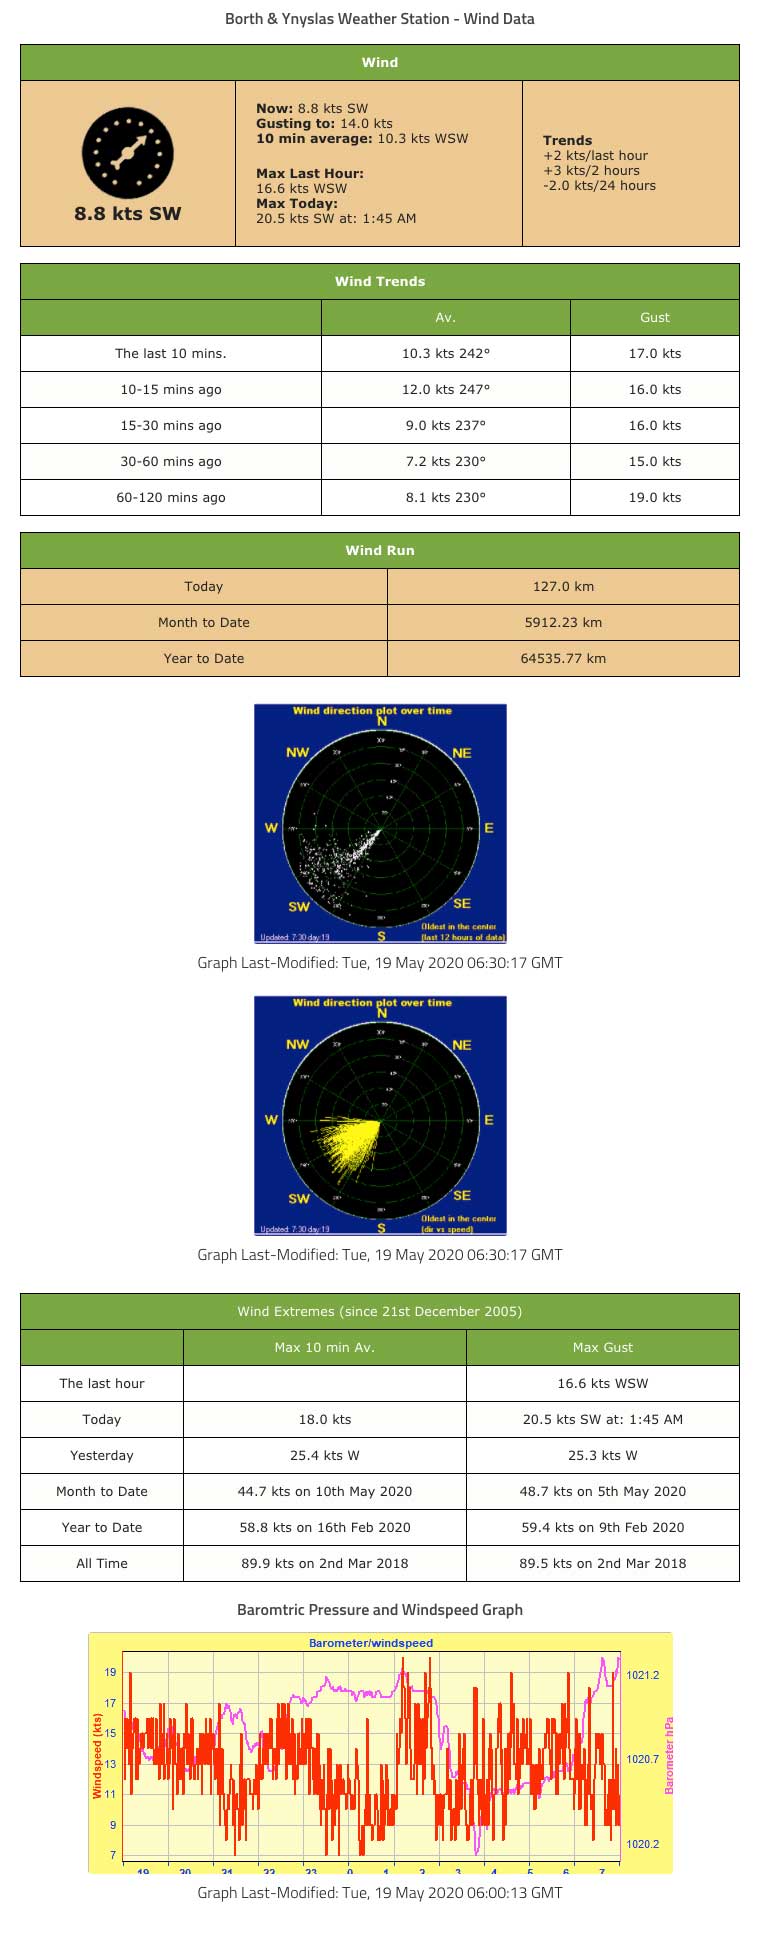
Current Wind Conditions at Borth & Ynyslas
This section shows the current wind conditions. It is the same as the table shown on the main overview page. The image on the left shows the wind direction and speed in knots. The knot is a unit of speed equal to one nautical mile per hour (1.85km/h, 1.15mph or 0.514 m/s).
Whilst it is nice to know what the wind is doing at any one moment, getting a snapshot from a single second isn’t often very useful as the wind is never completely constant and the instantaneous reading may have been taken during a gust or a lull. The middle section therefore expands on the instantaneous data . It repeats the information shown in the image but also shows what speed the wind is gusting to and the 10 minute average wind speed and direction. This gives you an idea of the variability in the wind and usually a better understanding of just how windy it actually is. Below this the maximum wind speed in the last hour, and also the maximum windspeed so far today is shown.
The section to the right displays the trends over the last hour, the last 2 hours and the last 24 hours. Note: The trends shown in this table are not shown on the mobile version of the page due to the constraints of the smaller screen. More information on the the way the wind speed and direction is changing over time is however shown in the ‘trends’ section which is the next table on the page on both desktop and mobile versions.
Wind Trends at Borth & Ynyslas
As one would expect, this table shows how the wind speed and direction has changed over time.
It shows the average wind speed and direction for several recent time periods and also shows the maximum gust during those times. Direction is displayed as a compass bearing where the figure indicates the compass bearing from which the wind is blowing.
Wind Run
Wind run is a meteorological term to show the total distance traveled by the wind over a period of time. Wind run can help to determine the rate of evaporation of moisture over a particular area. It may also be useful in determining the height of waves that might be encountered on large bodies of water.
The table shows the total wind run so far today, the total wind run so far this month and the total wind run so far for the year. The wind run is shown in kilometres.
Wind Plots over Time
Next on the page are two charts to show how the wind direction has changed over time. The first shows a scattergraph of wind direction readings over the past 12 hours. The oldest data is in the centre of the chart, the most recent towards the outer edges. In the sample below you can see that the wind had been blowing from somewhere between the W and SW for the 12 hours but had very gradually veered from more SSW to SW.
The second chart shows how wind speed and direction have been related over the same period of time. Longer yellow lines indicate stronger winds.
Note: These images are updated every 3 hours. The time stamp on them is GMT so adjust accordingly for BST if necessary.
Wind Extremes and Records from Borth and Ynyslas
The next table shows the maximum wind speed reached here at Ynyslas since recording started in December 2005. The table shows both the 10 minute average wind speed and the maximum gusts reached in:
- the last hour,
- so far today,
- yesterday,
- so far this month,
- so far this year,
- since recording began.
Note: Some of the records have been obscured in the sample image above as they are only available to subscribers.
Wind Speed and Barometer Plot
The final chart on the page shows the wind speed and barometric pressure plot over the past 12 hours. The purple lines shows the barometric pressure in millibars (mbar) / hectopascals (hPa). The red line shows the wind speed in knots. The scale of the graph adjusts automatically if necessary but in the sample below the wind speed has been fairly consistent over the past 12 hours so a scale with a wider wind range isn’t needed.
This same chart is also shown on the Barometric Pressure Data page. It is updated every 3 hours. The timestamp is when it was last updated and is based on GMT so should be adjusted for BST as needed.
That’s it for the wind data page for now. If I add more features I’ll update this page accordingly. Click the links below see similar samples and explanations of the other pages available from the Borth & Ynyslas Weather Station:
- Overview page
- Temperature & Humidity Data
- Barometric Pressure Data
- Wind Data Page
- Rainfall Data Page
- Extremes and Records Page
- Historical Data Page
- Moon and Sun Page
- Tide Times Page
To help support the running of the weather station, there is a small charge to access all of these pages and to see live up to the minute data from Borth & Ynyslas.
Click the button below to subscribe now:
or get a weeks trial for just £1 here:
And as always, ‘Enjoy the Weather‘