Weather Station Rainfall Data Page
This page gives an insight into the Rainfall Data Page of the Borth & Ynyslas Weather Station. It is intended to give those curious about registering an idea of the data they can get access to and to provide an explanation of the various data parameters and charts shown on the page. Subscribers to the Weather Station have full access to this and many other pages with live data updated every minute. You can see samples of the full list of pages available here.
Barometric Pressure Data from Borth & Ynyslas
As with most pages of the Weather Station, the Temperature and Humidity Data page is divided into the following sections:
- Current Conditions
- Trends
- Extremes / Records
- Comparisons
There are also a few other miscellaneous bits of information that may be of interest. I’ll explain each section in more detail below.
The Data is recorded by The Borth and Ynyslas Weather Station based at Ynyslas approximately 200m East from the Mean High Water Mark at 52º 31’04″N, 4º 03’06″W.
The rainfall sensor is a self-tipping bucket capable of measuring rainfall in 0.2mm increments. Rainfall data is updated every 10 seconds. It has a range of 0 to 9999mm per day or 0 to 9999mm per storm (rounded to 1mm at 200mm and above)
The rain collector is designed to meet the guidelines of the World Meteorological Organisation and is laser-calibrated for accuracy.
Current Rainfall Conditions at Borth & Ynyslas
This section shows the current rainfall conditions. It is the same as the table shown on the main overview page. Typically, the day I’m producing these pages there has been no rain, but the image on the left gradually fills up the more rain there has been and the total rain in millimeters so far today is shown below it. The figures to the right show:
- The total rain so far today (mm)
- The current rain rate (mm/hr)
- The max rain rate so far today (mm/hr)
- The total rain yesterday (mm)
There are also two other data points in this section that are only displayed if it has been raining or is currently raining. If it is currently raining there will be an entry for the duration of the current rain episode. Similarly, if it has been raining that day there will be an entry showing the time of the last rainfall.
Rainfall Trends at Borth & Ynyslas
As one would expect, this table shows how rainfall has been trending over time. Again, the fact that it hasn’t rained for a while makes the sample data below a little dry (ha, see what I did there!). Subscribers obviously see live, up to the minute data.
The table shows the total amount of rainfall for several different time periods and for the past 7 days.
Rainfall Totals at Borth & Ynyslas
The next table displays the total rainfall recorded by the weather station along with some details on the number of days with and without rain. It shows:
- The total rainfall so far this month.
- The total rainfall so far this year.
- The number of days with rain so far this month.
- The number of days with rain so far this year.
- The current number of consecutive days without rain.
- The date that it last rained.
Extreme Rainfall Events
Next are a couple of rainfall records for Borth & Ynyslas in the form of the wettest day on record and the wettest month on record. Note: Figures are obscured in the sample image below as is it only available to subscribers.
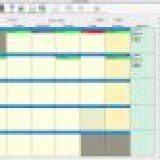
Rainfall Details and Comparison Chart
Finally there is a graphic that shows various rainfall details and some comparisons. Note: this image gets updated every half an hour, the time stamp is GMT so may need to be adjusted for BST as necessary.
Some of these data shown to in the left hand side of this graphic are the same as in the tables above but it also shows the rainfall totals for each of the past 7 days. The two charts on the right hand side show more information than might first be thought.
The bar chart with the green columns shows the total rainfall for each month of the year so far.
Below this is a line-chart that compares this years monthly rain with that of the average monthly rain since records began. This line-chart not only allows you to compare the monthly rainfall this year with the averages but also shows you how the rainfall averages out across the course of a year with November and December being the wettest months and April and May being the driest.
Using both charts together we can see how things compare. In the sample shown, January was a fairly average month with around 93mm of rain, February however was significantly wetter than average with 153mm whereas March, April and (so far) May had been unusually dry.
That’s it for the rainfall data page for now. If I add more features I’ll update this page accordingly. Click the links below see similar samples and explanations of the other pages available from the Borth & Ynyslas Weather Station:
- Weather Overview page
- Temperature & Humidity Data
- Barometric Pressure Data
- Wind Data Page
- Rainfall Data Page
- Extremes and Records Page
- Historical Data Page
- Moon and Sun Page
- Tide Times Page
To help support the running of the weather station, there is a small charge to access all of these pages and to see live up to the minute data from Borth & Ynyslas.
Click the button below to subscribe now:
or get a weeks trial for just £1 here:
And as always, ‘Enjoy the Weather‘