Weather Station Barometric Pressure Data Page
This page gives an insight into the Barometric Pressure Data Page of the Borth & Ynyslas Weather Station. It is intended to give those curious about registering an idea of the data they can get access to and to provide an explanation of the various data parameters and charts shown on the page. Subscribers to the Weather Station have full access to this and many other pages with live data updated every minute. You can see samples of the full list of pages available here.
Barometric Pressure Data from Borth & Ynyslas
As with most pages of the Weather Station, the Barometric Pressure Data page is divided into the following sections:
- Current Conditions
- Trends
- Extremes / Records
There are also a few other miscellaneous bits of information that may be of interest. I’ll explain each section in more detail below.
The Data is recorded by The Borth and Ynyslas Weather Station based at Ynyslas approximately 200m East from the Mean High Water Mark at 52º 31’04″N, 4º 03’06″W.
The integrated sensor suite contains the thermometer, the hygrometer and the barometer. These sensors are housed within a radiation shield to protect the sensors from solar radiation and other sources of radiated and reflected heat.
The Integrated Sensor Suite is mounted approx. 2.5m above the ground away from any sources of heat such as walls or tarmac.
- Barometric Pressure is updated every 15 minutes with a range of 880mb to 1080mb and a resolution of 0.1mb
Current Barometric Pressure Conditions at Borth & Ynyslas

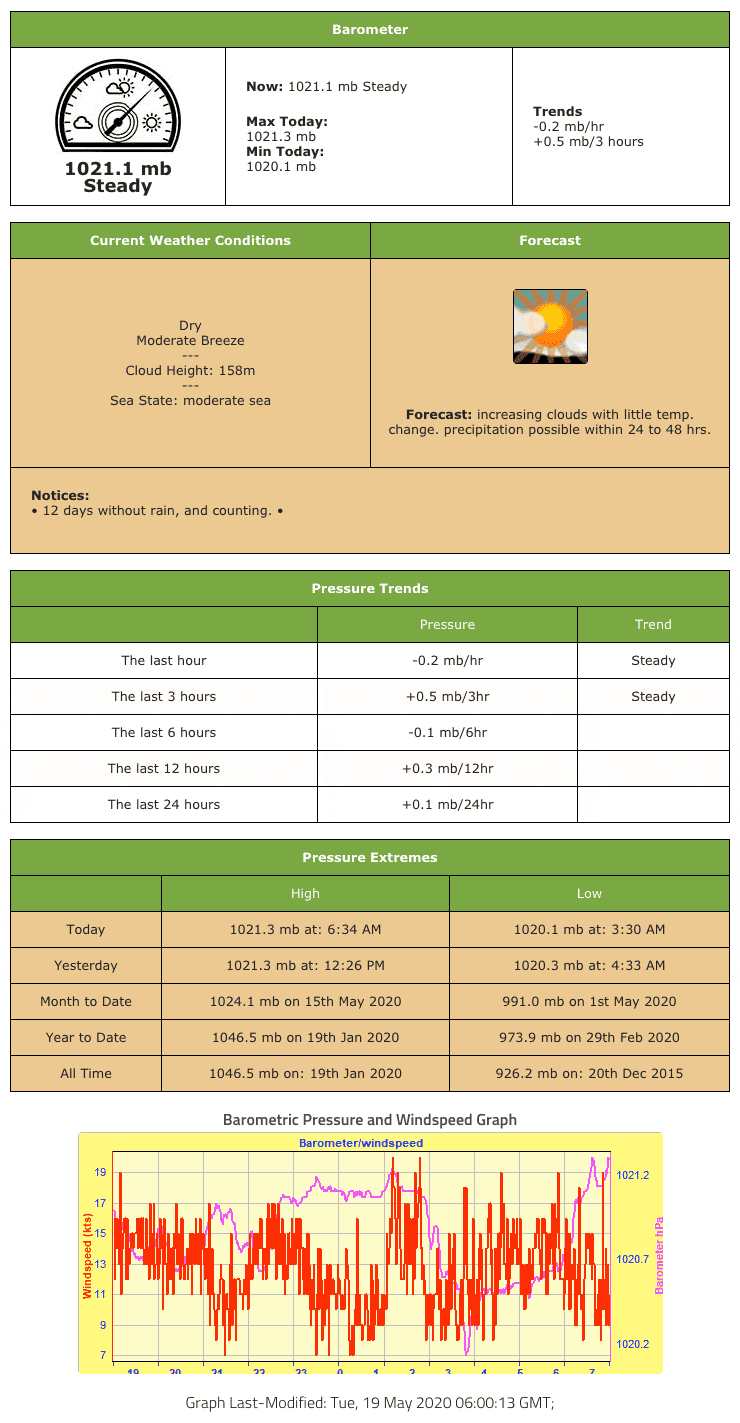
This section shows the current barometric pressure conditions. It is the same as the table shown on the main overview page. The image on the left shows the barometric pressure and whether it is steady, falling or rising. The reading is in millibars (mb) which is a meteorological unit of pressure equal to one-thousandth of a bar. A bar is a unit of pressure equal to 100,000 pascals (Pa). Thus one millibar is equivalent to 100 pascals or one hectopascal. The Hectopascal (hPa) is an SI unit, the international system of units now recommended for all scientific purposes so in theory I should use hPa here. However, 1mb = 1hPa and millibars sounds nicer and is more often used in weather forecasting.
The middle column of the table shows the current barometer reading along with the maximum and minimum so far today.
The right hand column shows how the pressure has been trending over the past hour and the past 3 hours to give an indication of how fast it is rising or falling. Note: The trends shown in this table are not shown on the mobile version of the page due to the constraints of the smaller screen. More information on the the way the pressure is changing over time is however shown in the ‘trends’ section which is shown further down the page on both desktop and mobile versions.
Current Weather Conditions and Forecast
Seeing as the current weather conditions and the forecast reported by the weather station are based partly on the barometric pressure, the next part of the page shows details of these. It is the same table as that shown on the main overview page.
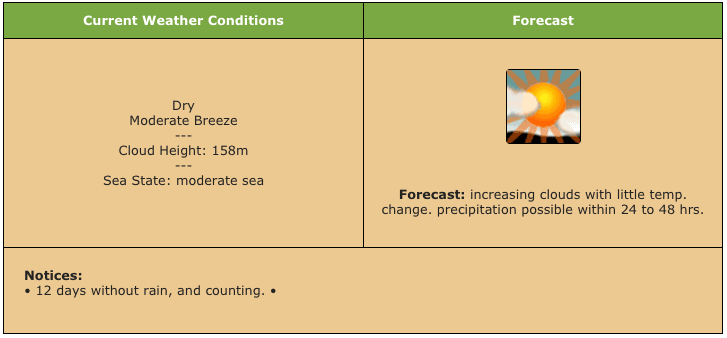
The left hand side of the table shows the current weather conditions and a description of the current wind conditions. It also shows an estimation of the cloud height based on a calculation using the current temperature and the current dew point.
The sea state is a description based solely on the current wind speed and wind run. Unfortunately it doesn’t take into consideration the wind direction.
The right hand side of the table shows a weather forecast as reported by the weather station. This is a poor substitute for a full forecast as it is simply an algorithmically generated forecast based on the various weather parameters from this single point and the way they have changed over the past few hours. As I’ve written elsewhere, the weather station is primarily aimed at recording the weather, not forecasting it, but the ‘forecast’ is presented here out of curiosity.
FInally, the bottom row of the table displays any weather warnings or notices that are currently being generated by the algorithms I have built. this will display notifications about extreme weather events such as heavy rain, strong winds, high or low temperature, record breaking events and anything of particular note.
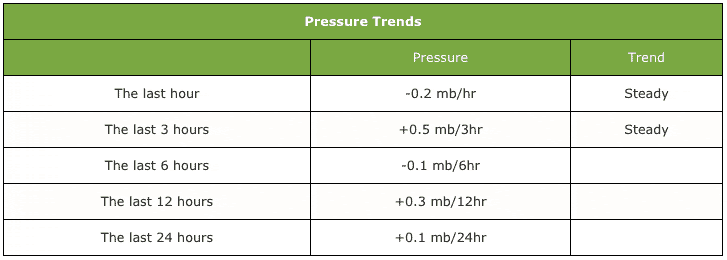
Barometric Pressure Trends at Borth & Ynyslas
The next table simply shows the pressure changes for given time periods over the past 24 hours.
Barometric Pressure Extremes and Records from Borth & Ynyslas
Few people get excited about record barometric pressure readings, but the following table shows them anyway! It shows the highs and lows for:
- so far today,
- yesterday,
- the month so far
- the year so far
- since recording began in December 2005
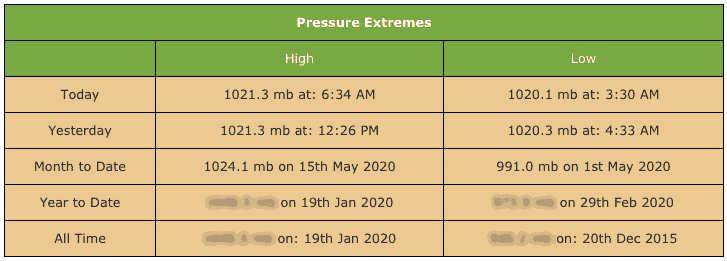
Note: Some of the records have been obscured in the sample image above as they are only available to subscribers.
Wind Speed and Barometer Plot
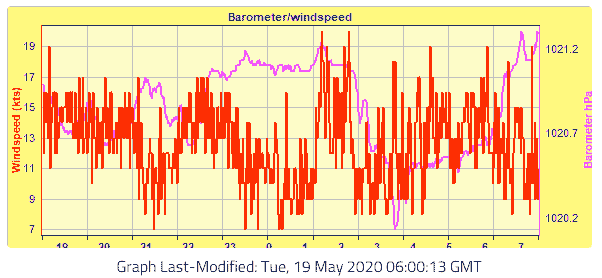
The final chart on the page shows the wind speed and barometric pressure plot over the past 12 hours. The purple lines shows the barometric pressure in millibars (mbar) / hectopascals (hPa). The red line shows the wind speed in knots. The scale of the graph adjusts automatically if necessary.
This same chart is also shown on the Wind Data page. It is updated every 3 hours. The timestamp is when it was last updated and is based on GMT so should be adjusted for BST as needed.
That’s it for the barometric pressure data page for now. If I add more features I’ll update this page accordingly. Click the links below see similar samples and explanations of the other pages available from the Borth & Ynyslas Weather Station:
- Weather Overview page
- Temperature & Humidity Data
- Barometric Pressure Data
- Wind Data Page
- Rainfall Data Page
- Extremes and Records Page
- Historical Data Page
- Moon and Sun Page
- Tide Times Page
To help support the running of the weather station, there is a small charge to access all of these pages and to see live up to the minute data from Borth & Ynyslas.
Click the button below to subscribe now:
or get a weeks trial for just £1 here:
And as always, ‘Enjoy the Weather‘
