Weather Station Temperature & Humidity Data Page
This page gives an insight into the Temperature and Humidity Data Page of the Borth & Ynyslas Weather Station. It is intended to give those curious about registering an idea of the data they can get access to and to provide an explanation of the various data parameters and charts shown on the page. Subscribers to the Weather Station have full access to this and many other pages with live data updated every minute. You can see samples of the full list of pages available here.
Temperature and Humidity Data from Borth & Ynyslas
As with most pages of the Weather Station, the Temperature and Humidity Data page is divided into the following sections:
- Current Conditions
- Trends
- Comparisons
- Extremes / Records
There are also a few other miscellaneous bits of information that may be of interest. I’ll explain each section in more detail below.
The Data is recorded by The Borth and Ynyslas Weather Station based at Ynyslas approximately 200m East from the Mean High Water Mark at 52º 31’04″N, 4º 03’06″W.
The integrated sensor suite contains the thermometer, the hygrometer and the barometer. These sensors are housed within a radiation shield to protect the sensors from solar radiation and other sources of radiated and reflected heat.
The Integrated Sensor Suite is mounted approx. 2.5m above the ground away from any sources of heat such as walls or tarmac.
- Temperature is updated every 10 seconds with a range of -40ºC to 65ºC and a resolution of 0.1ºC
- Humidity is updated every 50 seconds with a range of 0% to 100% and a resolution of 1%
Current Temperature Conditions at Borth & Ynyslas

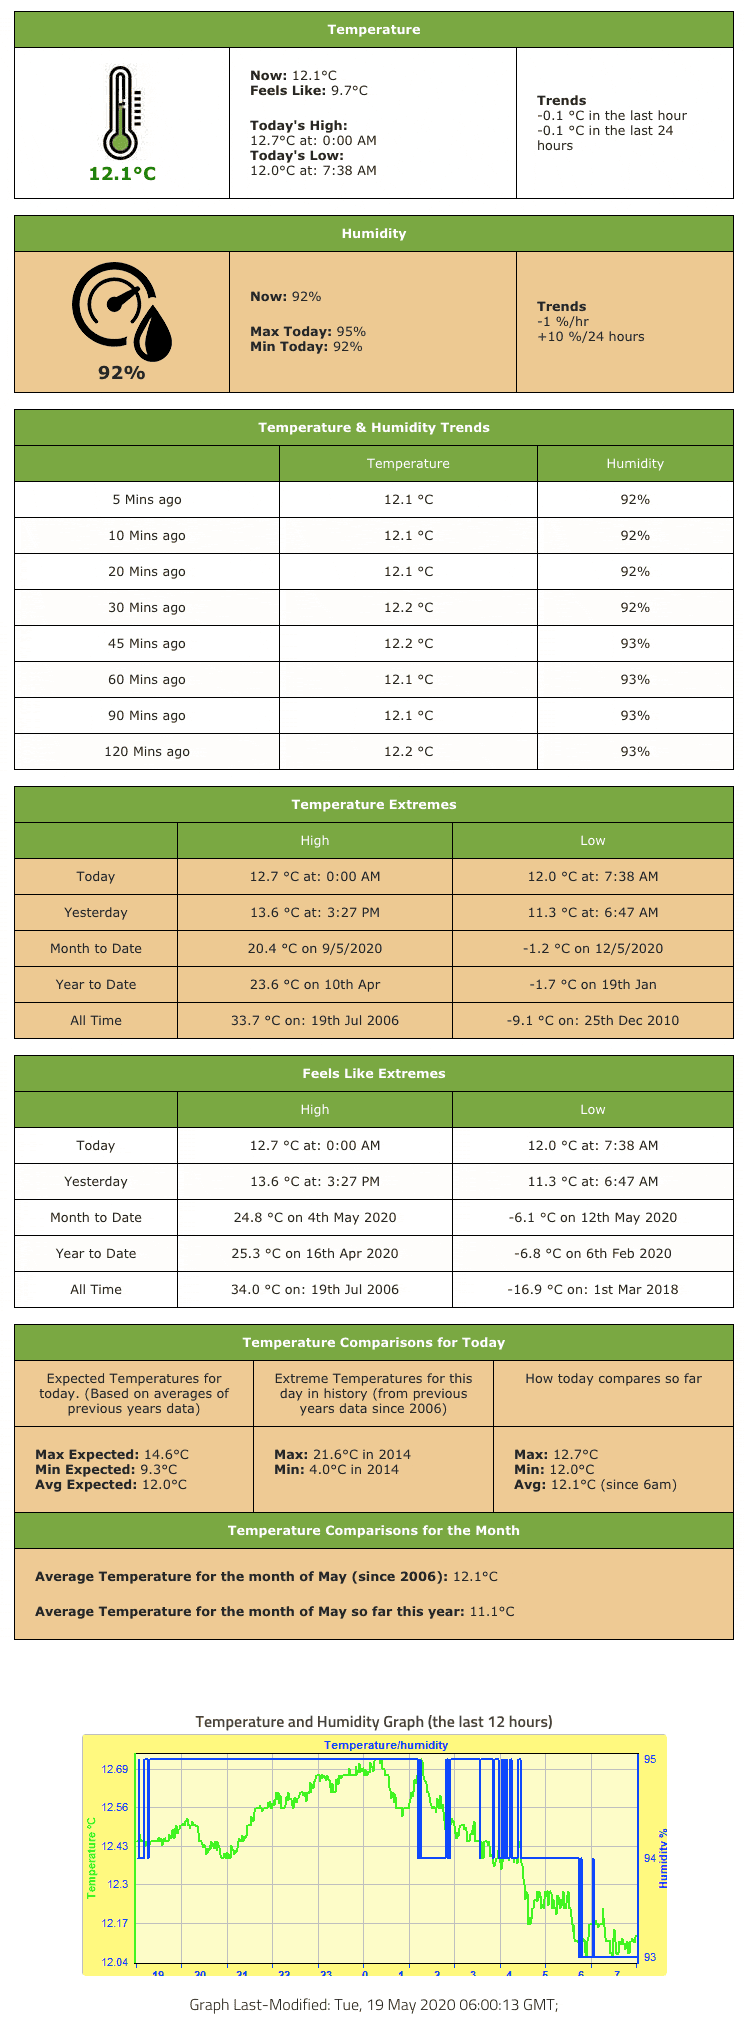
This section shows the current temperature in Borth & Ynyslas. The graphic to the left displays the temperature in degrees celsius. The middle column of the table shows the current temperature again and also the ‘Feels Like’ temperature. The Feels Like Temperature is a calculation based on the air temperature, the relative humidity and the wind speed, to posit a human-perceived equivalent temperature. The result is also known as the “felt air temperature”, “apparent temperature”, “real feel” or “feels like” and it gives an idea of how hot or cold it feels.
This section also shows the maximum and minimum temperatures reached so far today, and when they wer experienced.
The column to the right displays the trends over the last hour, the last 2 hours and the last 24 hours. Note: The trends shown in this table are not shown on the mobile version of the page due to the constraints of the smaller screen. More information on the the way the temperature is changing over time is however shown in the ‘trends’ section later on the page on both desktop and mobile versions.
Current Temperature Conditions at Borth & Ynyslas
This section shows the current humidity in Borth & Ynyslas. The graphic to the left displays the humidity. The ‘dial’ itself is simply a graphic and doesn’t change The middle column of the table shows the current humidity again and also shows the maximum and minimum humidities reached so far today.
The column to the right displays the trends over the last hour, the last 2 hours and the last 24 hours. Note: The trends shown in this table are not shown on the mobile version of the page due to the constraints of the smaller screen. More information on the the way the humidity is changing over time is however shown in the ‘trends’ section which is the next table on both desktop and mobile versions.
Temperature and Humidity Trends
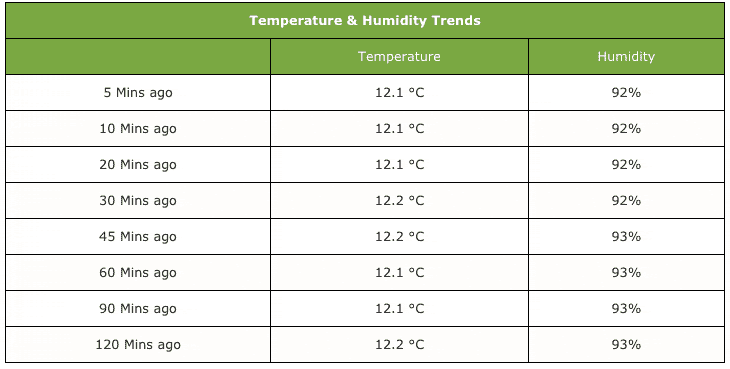
As one would expect, this table shows how the temperature and humidity has changed over time.
It shows the temperature and the humidity readings for several recent times over the past 2 hours.
Temperature Extremes and Records from Borth & Ynyslas
The next table shows the maximum and minimum temperatures recorded by the weather station. It shows the highs and lows for
- so far today,
- yesterday
- so far this month
- so far this year
- since recording began in December 2005
Humidity extremes are of little value so these aren’t showsm but instead the next table shows the maximum and minimum Feels Like temperatures for the same time periods.
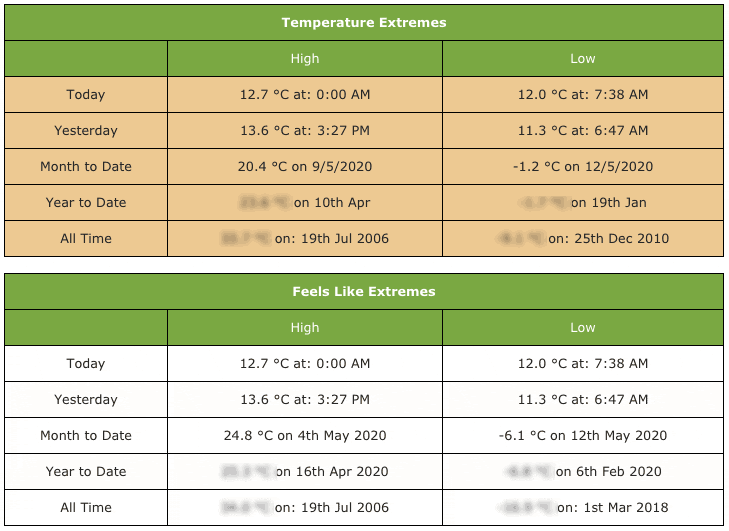
Note: Some of the records have been obscured in the sample image above as they are only available to subscribers.
Temperature Comparisons
The next table is one of my favourites as it provides some comparisons of the temperature today and so far this month to those temperature recorded since 2005. Having minute by minute data going back to 2005 (almost 15 years worth of data as I write this) allows me to make comparisons with previous years which gives an idea of how things are compared to the ‘normal’ conditions expected.
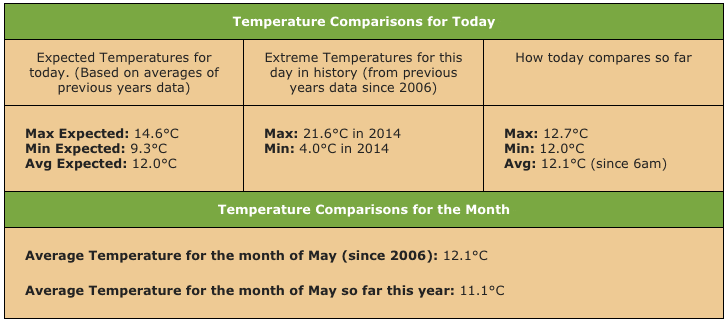
The ‘temperature comparisons’ table shows:
- The expected maximum, minimum and average temperatures for this day of the year based on the averages of historical data.
- The Highest and Lowest temperatures reached on this day of the year from the historical records.
- The current maximum, minimum and average temperature so far today. This enables you to see how today is shaping up in comparison to the average and extremes from the same day in the past.
- The average temperature for the current month since recording began.
- The average temperature for the current month so far.
The sample data above shows that the average temperature on this day of the year since 2006 has been 12ºC with an average high of 14.6ºC and an average low of 9.3ºC. The highest ever reached on this day of the year was however a balmy 21.6ºC whereas the coldest was 4.0C. The fact that thee were both in 2014 suggest that this day in 2014 was a clear one where temperatures dropped overnight but soared in the sunshine during the day. By contrast, so far this year the day has seen little temperature variation with a high of 12.7ºC, a low of 12.0ºC and an average temperature of 12.1ºC which is pretty much normal for the time of year.
As far as the month is shaping up in the data then so far it has been a little cooler than average, but that would be expected in May as the second half of may would in general be warmer than the first half of May as we move closer to summer.
Temperature and Humidity Plot
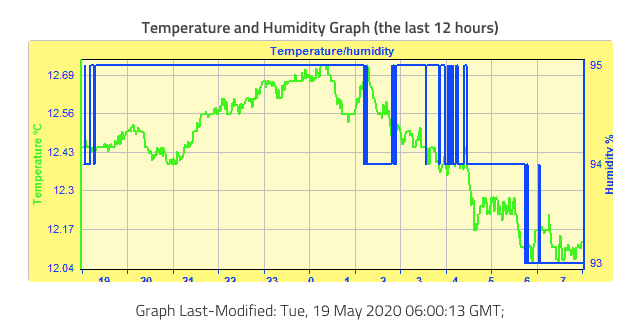
The final chart on the page shows the temperature and humidity plot over the past 12 hours. The green lines shows the temperature. The blue line shows the humidity. The scale of the graph adjusts automatically if necessary.
The plot is updated every 3 hours. The timestamp is when it was last updated and is based on GMT so should be adjusted for BST as needed.
That’s it for the temperature and humidity data page for now. If I add more features I’ll update this page accordingly. Click the links below see similar samples and explanations of the other pages available from the Borth & Ynyslas Weather Station:
- Weather Overview page
- Temperature & Humidity Data
- Barometric Pressure Data
- Wind Data Page
- Rainfall Data Page
- Extremes and Records Page
- Historical Data Page
- Moon and Sun Page
- Tide Times Page
To help support the running of the weather station, there is a small charge to access all of these pages and to see live up to the minute data from Borth & Ynyslas.
Click the button below to subscribe now:
or get a weeks trial for just £1 here:
And as always, ‘Enjoy the Weather‘
