Solar Panels – Payback Time
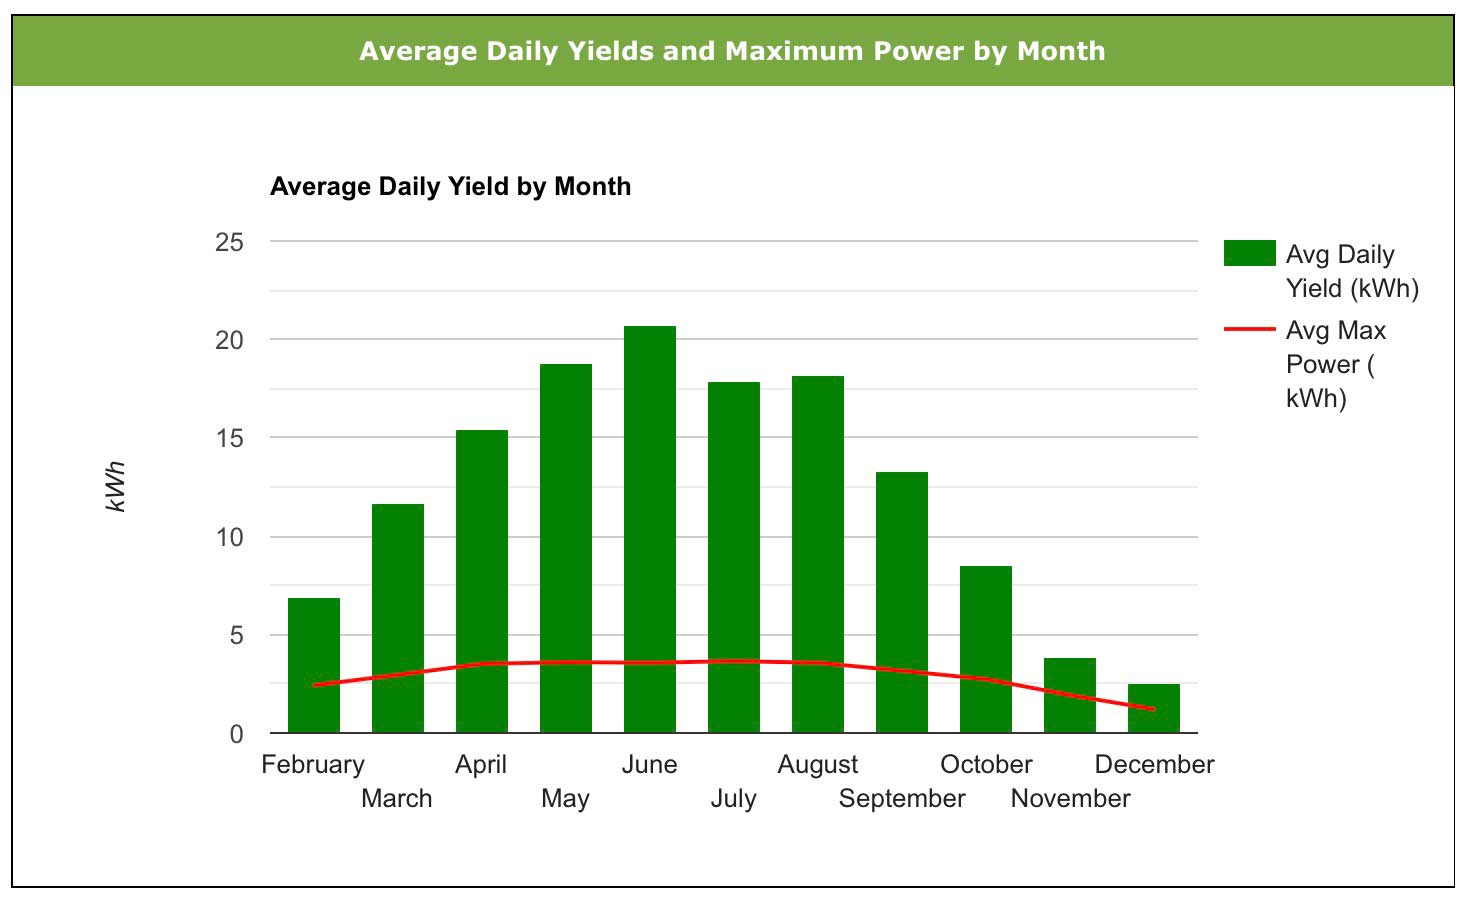
Now that we’ve had our solar panels installed for over 2 years, I thought it was time to make sure we could compare the yield from them per year. As you can imagine in a country with such unpredictable weather the yield from the solar panels varies considerably. From day-to-day the variations are thanks to the ever-changing weather. There are of course distinct monthly variations too. These are mainly due to the changing day length, the lower angle of the sun and once again the weather. As you would expect, the average daily yield is much higher in the summer months than it is in the winter months. You can see this in the chart below, where the average daily yield in June is 20.8 kWh but in December it is only 1.2kWh
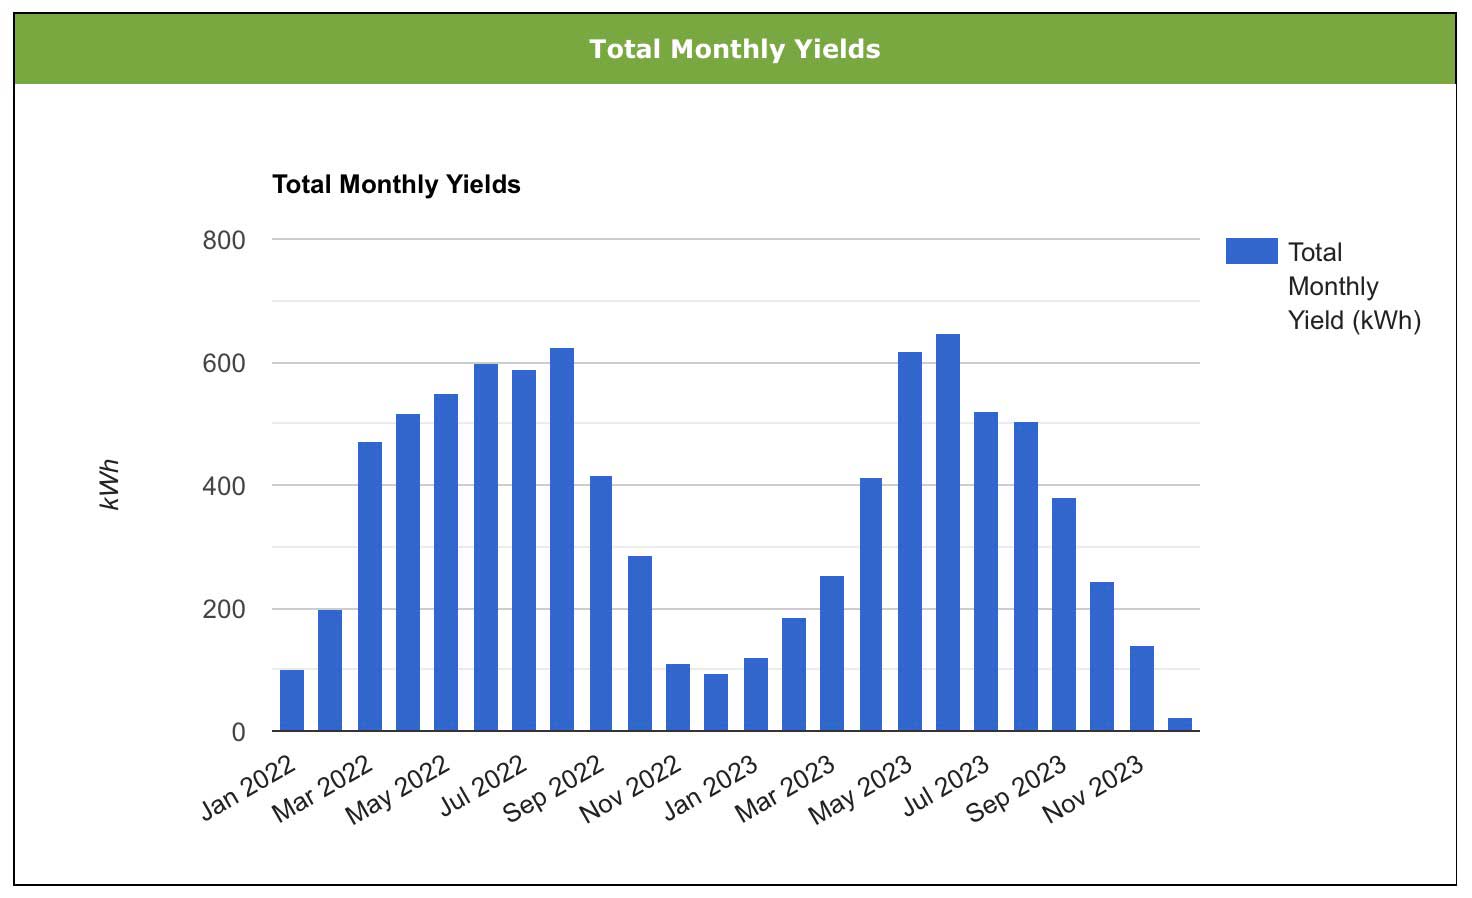
Similarly, the total monthly yields vary with the season too. The chart below shows the total monthly yield for the most recent 24 months following a summer/winter pattern.
Annual Yields
Annually, things should balance out. There will of course still be some variation as no two years are the same, but over the course of an entire 12 months day lengths will be the same and the weather patterns will even out. So, I’ve just added a ‘Total Annual Yields’ chart to the ‘Records and Averages’ page of the Solax WordPress plugin that I built for this site. You can see this new chart (as it looked whilst writing this blog post) below. Obviously, on the page itself it updates all the time to report the latest data.
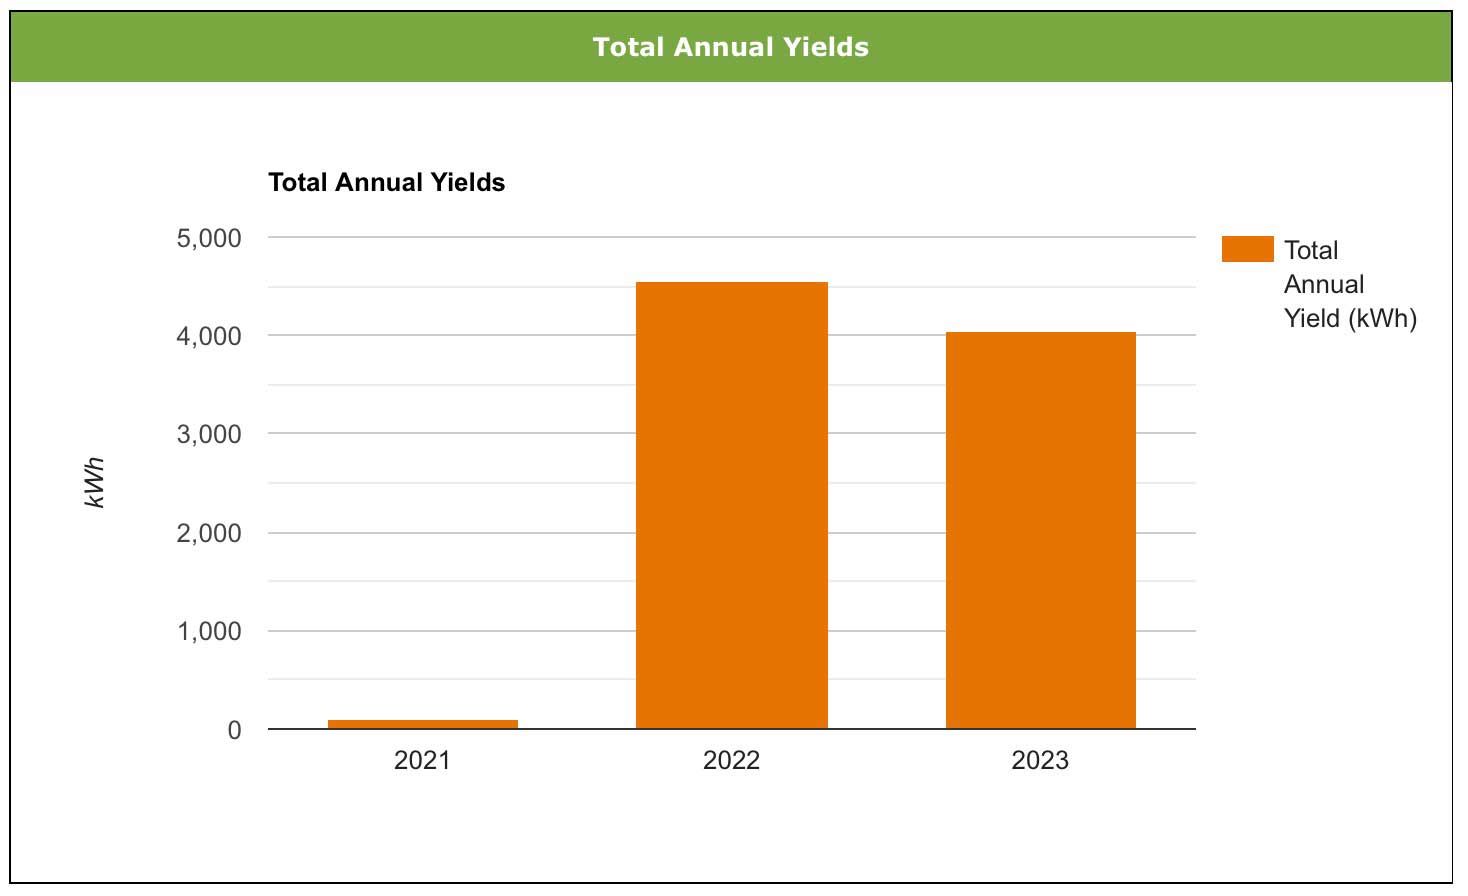
Note: The panels were installed in Nov. 2021 so the total yield for that year only includes December and part of November (two of the worst-performing months!). The Total Yields for 2022 and 2023 are however more complete and as you can see by the time 2023 is over they should both be over 4000 kWh.
2022 looks as though it will have been a better year, maybe it was sunnier, maybe the panels’ performance has dropped off a little (they could do with a good clean at the moment if nothing else!). We’ll have to see how 2024 compares.
Savings
So, with an average annual yield of around 4300 kWh per year and our electricity currently costing £0.36 per kWh then that’s a saving of £1548 per year. Not bad!
It’s even better when you take into consideration the fact that we are also able to ‘ rate-shift’. This is because we can charge the battery during the off-peak period (at £0.15 per kWh) and use that cheaper electricity during the day, so there’s a saving there as well.
This ability to rate-shift means that we have shifted our use to about 90% off-peak and 10% peak rate. Prior to having the solar panels and battery it was about 60% off-peak and 40% peak. That too will have added to those annual savings. It’s a little difficult to work out exactly how much the rate-shifting has saved but it probably takes the annual savings up closer to £2000. The solar panels and battery cost just over £7000 to install so they should have paid for themselves in under 4 years.
Discover more from A Simple Life of Luxury
Subscribe to get the latest posts sent to your email.