Building a Solax WordPress Plugin
I couldn’t resist building a Solax WordPress plugin as a project following the installation of our new solar panels and battery. The Solax Inverter has a Wi-Fi dongle that uploads data to Solax Servers where we can see various stats about the usage on the Solax Cloud portal. There is also a Solax App that allows to to see this on our phones too.
That’s all well and good and the data there is displayed in a nice format for the most part. It does have a few flaws though.
- There is no easy way of sharing the data or embedding it into our own website for others to see.
- The ‘Yield’ that is reported by the Solax data includes any discharge from the battery as well as that from the solar panels. I wanted to know how much the Solar panels themselves were producing.
The Solax API
Some of the data is available through a Solax API. This in itself is fairly limited. Essentially, it is a URL that returns JSON fomatted data via the http protocol. There isn’t a huge amount of data in the JSON file but it had enough for me to work on. Here’s an example of the JSON data
{"exception":"Query success!","result":{"inverterSN":"xxxxxxxxxxx","sn":"xxxxxxxxxxx","acpower":2124.0,"yieldtoday":0.8,"yieldtotal":116.3,"feedinpower":-17.0,"feedinenergy":10.19,"consumeenergy":299.97,"feedinpowerM2":0.0,"soc":83.0,"peps1":0.0,"peps2":null,"peps3":null,"inverterType":"3","inverterStatus":"102","uploadTime":"2021-11-30 08:03:14","batPower":-2186.0,"powerdc1":2.0,"powerdc2":0.0,"powerdc3":null,"powerdc4":null},"success":true}
As you can see, it’s simply a list of data, some of which is incorrect as far as I was concerned due to point 2 listed above. There was however enough data for me to fix that.
Building a WordPress Plugin
As our website (that you are reading this on) is based on WordPress I decided it would be a nice little project to build a WordPress plugin that would
- Retrieve the JSON data from the Solax API.
- Insert the data into a MySQL database on the webserver.
- Manipulate the data to show the figures I was interested in,
- Use the data to create some nice looking charts for display on the website.
Retrieving the JSON data from the Solax API was relatively straight forward once I allowed access to the Solax server through the webhosts firewall.
Inserting that data into a MySQL database was easy too. The Solax API is updated at 5 minute intervals. I didn’t want to store the data from every 5 minute update as a separate row in the database though. I thought it would be unnecessary and would soon result in a very large database. Instead I decided that a single row for each day would be sufficient.
So, the first bit of logic was to write a quick script that Inserted a new row into the database for the first entry of the day and then subsequently updated the row for the rest of the day. Relatively straight forward so far. I wanted to know things such as the peak output for the day and the times of first generation and last generation as well. So a few columns were added to the database to store this information and some logic written into the script to calculate the values and update the database accordingly.
With the main database Insert and Update scripts written it was time to set up a Cron Job on the webserver. This would trigger every five minutes and run the script that would retrieve the JSON data and add it to the database.
Building a Plugin
Next was to make this into a proper plugin for WordPress. This involved creating a settings page within the WordPress admin panel where I (and others if I release it) could enter various settings needed for the plugin to work. This included the Token ID and Serial number needed to communicate with the Solax server. I also added settings to individualise the specifications of a particular solar installation. This included details such as the power of the solar array, the capacity of the battery and such like.
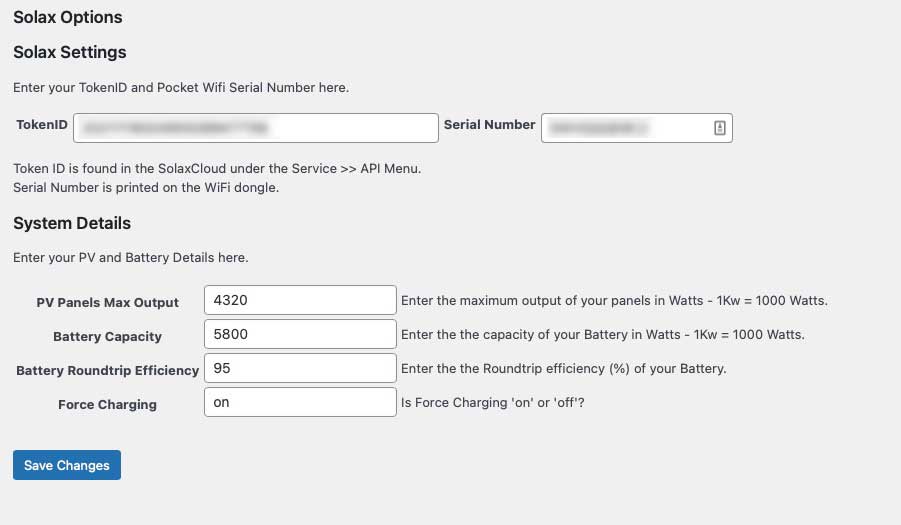
These specification numbers would be used to make calculations on the data and draw the various charts.
The plugin itself was a fairly simple affair. Essentially it performed the various calculations, drew the various graphs and then formatted all of this in an easy to read format and was output to a WordPress page via a WordPress ShortCode.
Essentially once installed all someone needed to do was add the parameters to the settings page and insert a Shortcode into a WordPress page and it would all be displayed. Although, saying that I have put some Google Chart code into a custom header for the page so I might need to find out how to incorporate that into the plugin rather than the theme if I’m going to release it as a plugin.
Yield Measurements
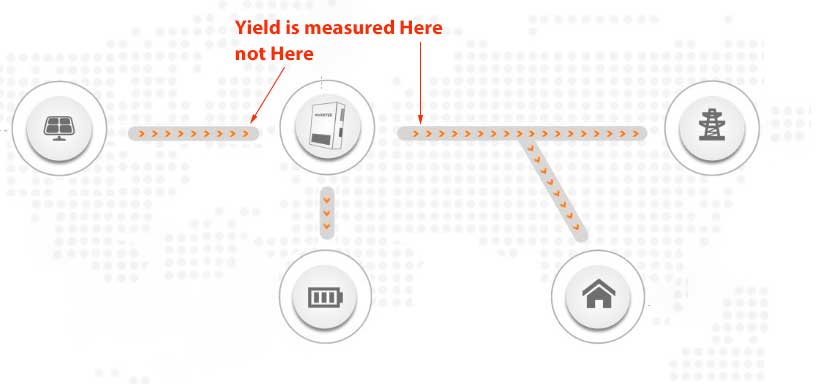
As I mentioned above, I wasn’t happy with the fact that the Solax ‘Yield’ data included any energy discharged from the battery as well as the energy coming from the solar panels. The reason for this is that the measurement for this data point is taken downstream of the inverter rather than downstream of the solar panels.
If we weren’t force charging the battery from the grid on cheap rate electricity overnight then this wouldn’t be an issue because energy in the battery would have come from the solar panels anyway. However, we are (over the winter) force charging the battery from the grid. This allows us to maximise our time using cheap rate electricity when there isn’t enough solar power to meet our needs.
The problem is, we are putting around 5.22kWh of energy into the battery from the grid each night (90% of its total capacity). This is then measured as ‘yield’ when it is discharged. Some days we might actually produce less than 1kWh from the solar panels, but Solax will report the yield as over 6kWh because it includes this 5.22kWh discharged from the battery. I’ve emailed Solax about this issue with their reporting of the data but haven’t heard back from them.
It won’t be an issue when Force Charging is off but at the moment it means that we don’t have a ‘yield’ value that even closely approximates the actual yield from the solar panels. Solax also uses this ‘yield’ figure to calculate monthly, yearly and total yields too. All of which will be highly inaccurate when force-charging is on. Fortunately I could fix this to a certain extent in the Plugin I was building.
Data Manipulation
I therefore added a setting to the settings page that allowed me to register if Force-charging was on or off (unfortunately that isn’t a piece of data recorded in the Solax API). If force charging is off then I use the Solax ‘yield’ data as it should be accurate. I however, if force-charging is on I do some calculations on the yield data to subtract the yield coming from the battery.
As none of this is measured directly I did have to make a few assumptions that might skew the data slightly, but only by a small amount, if at all. The calculation is based on the capacity of the battery, the maximum state of charge reached that day and the current state of charge. I also added a slight adjustment to take into consideration the roundtrip efficiency of charging and discharging. There are of course some small loses during the process of force-charging and discharging which means that what comes out of the battery is actually slightly less than its actual capacity. This roundtrip efficiency adjustment accounts for these. I might even add in a factor that increases this adjustment based on the age of the battery as its performance will of course degrade a little over time.
This is the basic equation,

Graphs and Charts
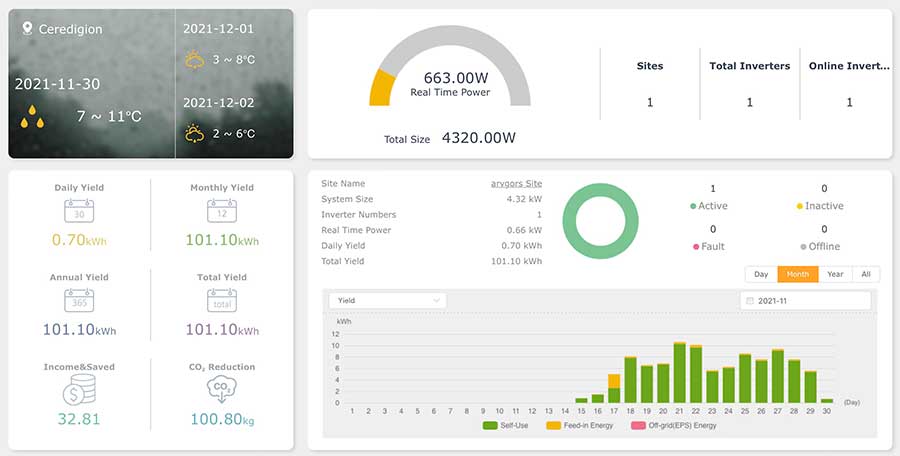
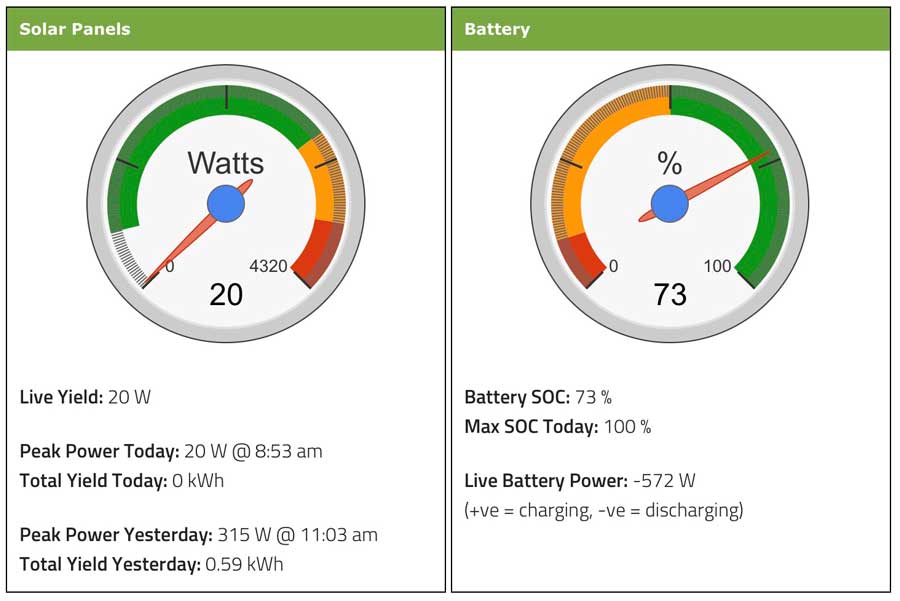
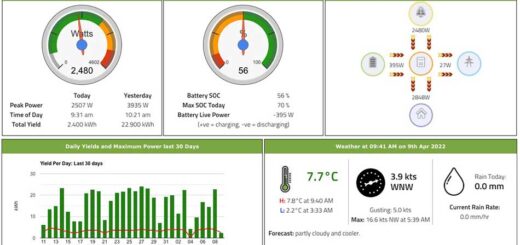
With much of the maths done it was time to move onto the graphs and charts and some slightly more involved MySQL database queries. The gauges for the live yield from the solar panels and the battery capacity were quite straight forward. I also included the peak power output from the panels that day and the figures from yesterday as a comparison.
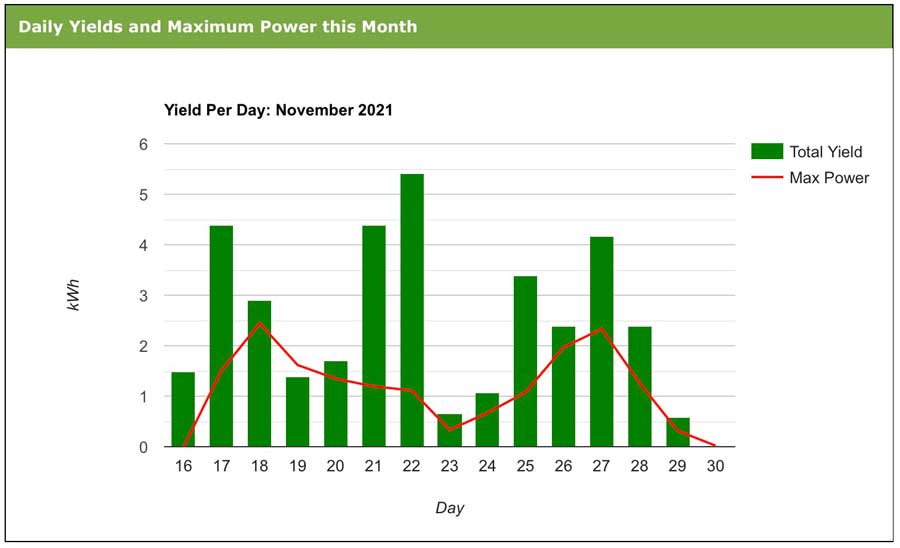
I wanted to show the daily yields for the current month. I also added the peak power output for each day to this graph.
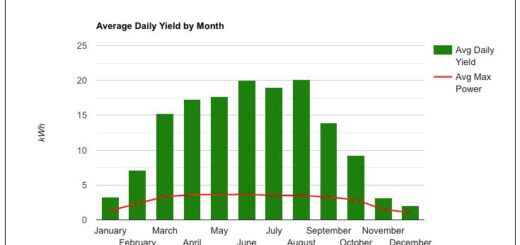
I also wanted to show the average daily yield for each month. I can’t check this until I have more data but it should show how the daily yield varies throughout the year.
A similar graph was added to the ‘records and averages page‘ that will show the average total yield for each calendar month too. Again, until I have more data I can’t check if this is working as intended.
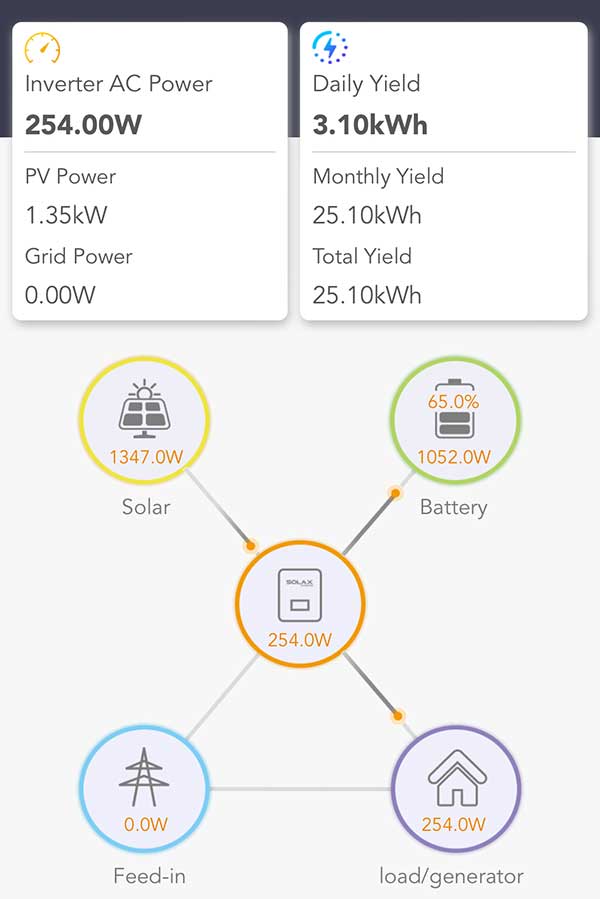
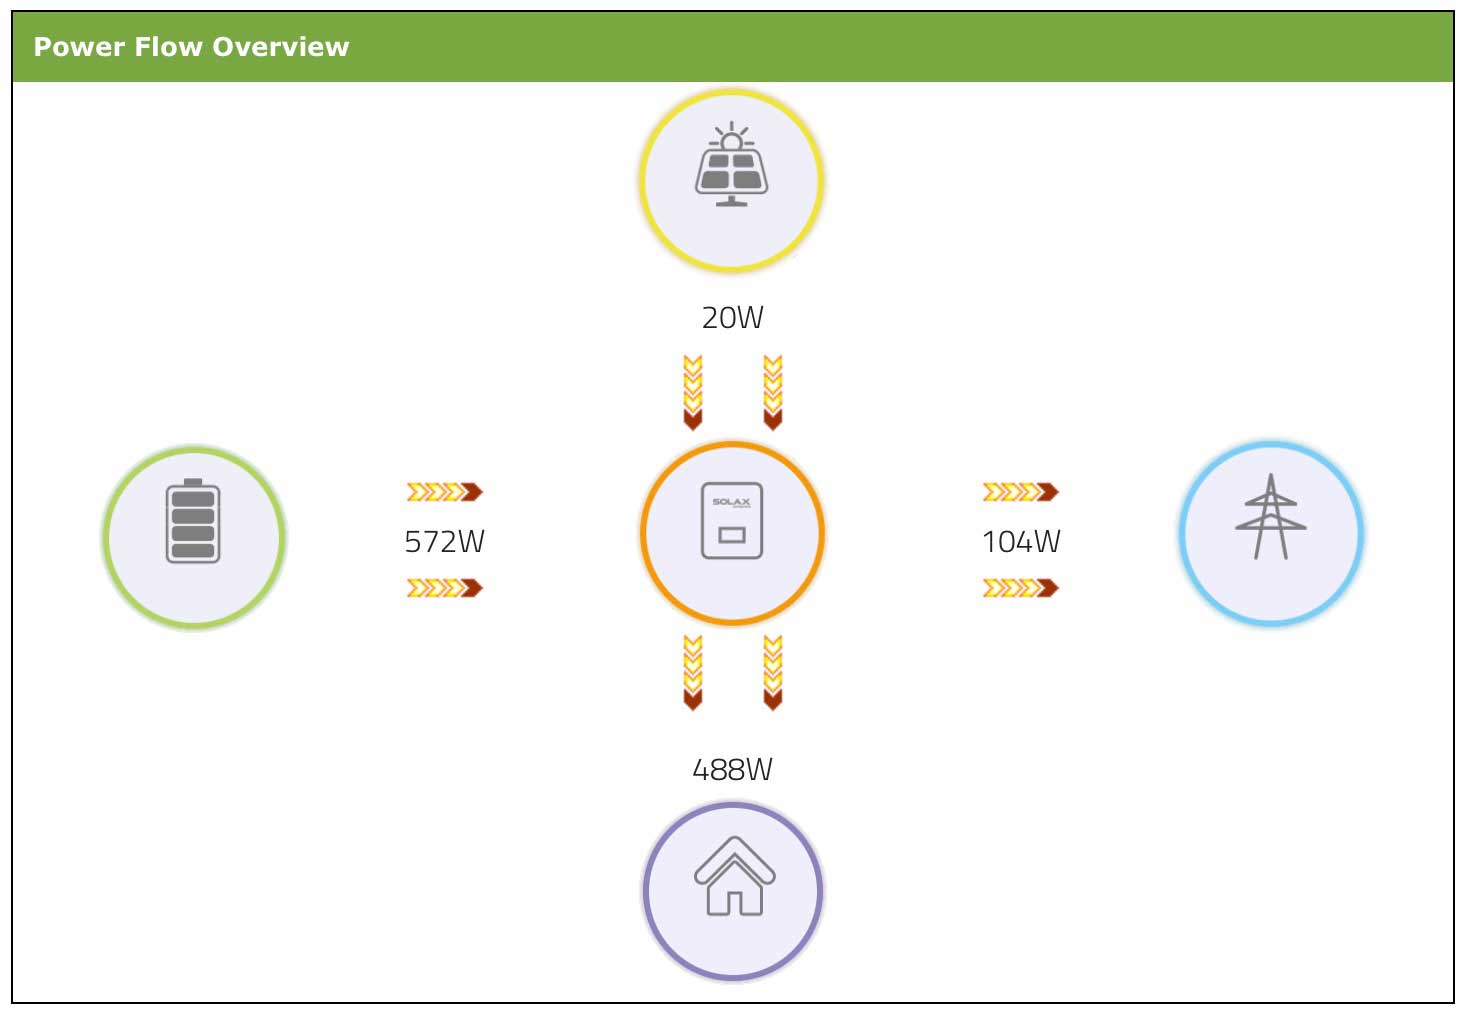
I also created a little flow diagram to show the flow of energy through the system at any given time.
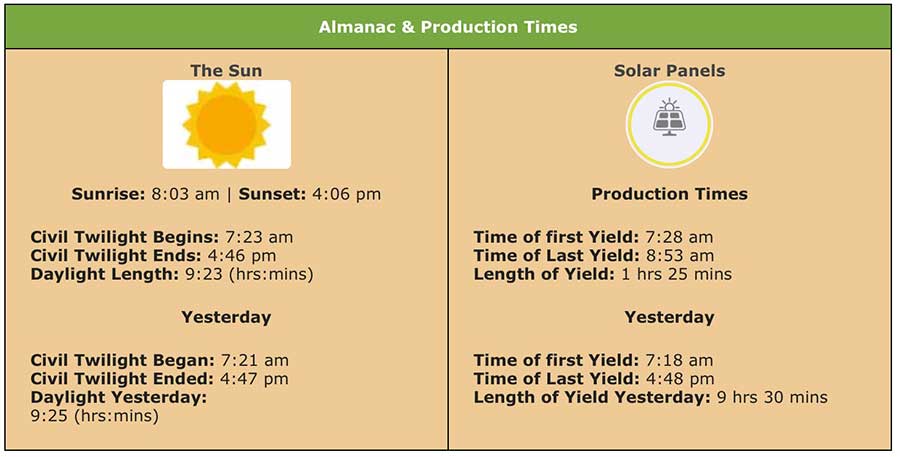
While I was at it I did a few calculations to work out the time of sunrise, sunset and the civil twilight hours for today and yesterday and presented these alongside the times of first and last power generation from the solar panels. I find this kind of interesting!
I also use the yields I’ve calculated that doesn’t include the yield from the battery to present daily, monthly, annual and lifetime yield totals that will be much more accurate than those presented by the Solax Cloud or App.
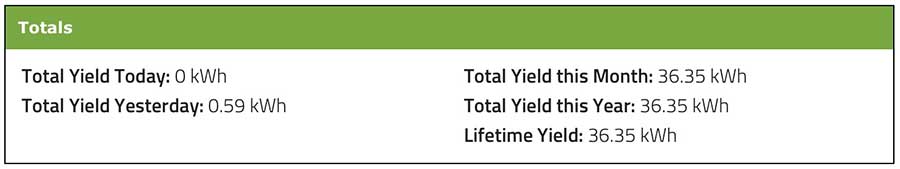
By comparison at the time of writing, the Solax figures are reporting a daily yield of 1.7kWh (all from the battery), and a Monthly, Annual and Lifetime Yield of 102.1kWh – almost 3 times as much as we have actually produced!
I’m quite pleased with it so far and might add some extra analysis pages to it in the future once I have more data. You can see it in action here: https://www.alananna.co.uk/blog/solar-generation/
It all ties in nicely with the Weather Station data from our garden also reported on this site. The weather station has over 15 years worth of data and now that we have solar panels I might add a solar radiation sensor to it one day so that I can add the data from it to the Solar Generation pages.
Discover more from A Simple Life of Luxury
Subscribe to get the latest posts sent to your email.
16 Responses
-
[…] only had the panels and battery for a few months, but the stats from the app I built already show signs of improvement as we move towards Spring. As expected, the average daily yield […]
-
[…] a ‘Total Annual Yields’ chart to the ‘Records and Averages’ page of the Solax WordPress plugin that I built for this site. You can see this new chart (as it looked whilst writing this blog post) […]
-
[…] added some new data features to my Solax Solar Panel Plugin for WordPress. This plugin isn’t publicly available for a few reasons, but I use it on this website to display […]
-
[…] in November 2021, I wrote a post about how I built my own Solax WordPress plugin to display data from our inverter in real-time. It worked extremely well for years, and for […]


Glad you are having fun Al !
I did read and understood your explanation but other than that it’s above me lol
I totally love it. I have my solar plant for a week now and looking for some other data interpretation as u did. So far only via Solax API but I am not really good at it. I have no clue we’re to start 😉
The API is fairly limited so there isn’t a huge amount you can do with the JSON feed from it but it does at least mean it’s relatively easy to get your head around as well. Saving the data into a MySQL database was what made the difference for me as once it’s there it’s easier to manipulate. Although to be honest, what my plug-in shows isn’t really anything extra to what the Solax portal shows, but it did allow me to present it in the fashion I preferred and to embed it into my website.
Have fun, and enjoy your solar – what size system have you got??
Al.
Hi Alan,
I have around 10kWp for a few days. I am really new in this are and learning a lot. I am also not exer in coding or other similar topics. I saw many projects so far I was not sucesfull to move forward to play with collected data.
Daniel
I guess you mean that you’ve produced 10kWh on a few days – that’s about what we are producing at this time of year from our 4.3Kwp array. You can see our average daily yield by calendar month in the first chart here: https://www.alananna.co.uk/blog/solar-generation/?action=records
So far in October the average yield has been 10.635kWh per day.
Al.
Hey, this looks great. We have a solax system, which we are mostly really pleased with, but the yield reporting is driving us crazy!
Did you ever get as far as releasing the plugin for WordPress ?
Would be great to give it a try, and see how it works compared to the solax website and app.
Not yet – I should do really as I’m sure it’ll be useful for others, but I just haven’t had the time.
I’ll put it on my to do list!!!
Al.
Hi Alan, We’re having our solax install next week and I’m hoping to extract the data from the inverter to have a play around. Love spreadsheets and database and graphs. This is going to be a big help.
Thanks for your effort and for sharing it. Much appreciated
Dear Alan, i would second the idea of releasing a WP-plugin for that! Would also use it. Best regards, Gerdsch
Hi Alan, Can I ‘third’ the suggestion of releasing this as a wordpress plugin. Have just had our system installed and would love to share our stats with people. Your charts and displays look great – clear and easy to understand
looks good ???? where or under what can the plugin be found? thx
It’s not available publicly – I keep thinking about releasing it but it would need quite a bit of work to do so and I just haven’t had the time.
Al.