Self Sufficient
We haven’t quite made it to being self-sufficient from an energy point of view yet but we’re not far off. Considering the fact that it is only March that’s not too bad. Not only that but much of the energy we have imported from the grid has been during off peaks times so it doesn’t cost as much anyway. We turned off the heating the other day and also the force-charging of the battery. Since then the energy requirements have dropped considerably. Coupled with some sunny days and our stats over the past few days have been good.
| Date | Imported (kWh) | Exported (kWh) | Sent to Car (kWh) |
|---|---|---|---|
| March 19th | 11.8 | 0.8 | 12.0 |
| March 20th | 14.8 | 1.4 | 11.4 |
| March 21st | 7.3 | 0.2 | 0 |
| March 22nd | 5.3 | 1.0 | 7.7 |
Timing
We’ve timed things well so that there has been minimal export. The import from the grid has been fairly low and we’ve been using the power in the battery well. The overnight background usage is low and on some occasions we’ve been able to almost cover this with what’s left in the battery. On top of that, we’ve ben charging the car with any surplus. The fact that I’m off work today so the car is still on the drive means that it might hit 100% charge by the end of the day.
Here’s the inverter graph from Monday.
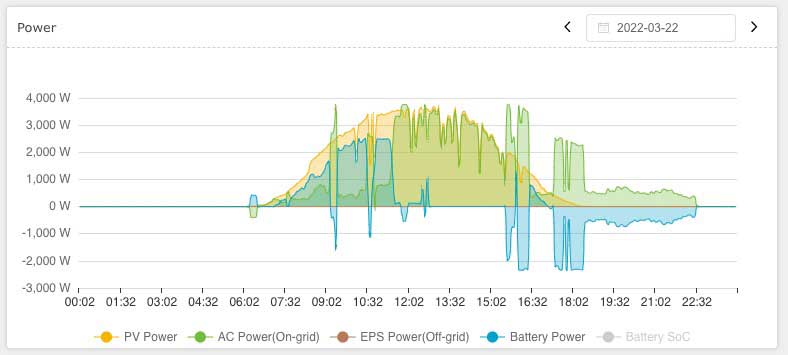
The yellow ‘PV Power’ line shows the energy being produced by the solar panels. It’s a nice steady curve throughout the day with just a few dips as clouds passed over. It peaked at 3680W around midday. This is just as you would expect from a nice sunny day.
The blue line shows the Battery Power. Positive numbers mean that the battery is being charged, negative values mean that we are drawing power from the battery. If it’s at zero then the battery isn’t being used – either because it is at 100% charge and isn’t needed or because it is at its minimum of 10% charge. We’re not sure what the little blip in the battery at around 6am is – it looks as though it was charging for some reason, I think this was just a short draw from the grid to keep it at 10%. As the sun rose we then started to charge the battery and cover our usage from the solar panels too. The blip at around 9am was probably me having a shower. Throughout the morning we were we charging the battery and using no peak rate electricity. We were also doing plenty of laundry and dish-washing too. The battery was fully charged by around 11:30am. By this time the solar panels were generating as much as they could which is plenty to charge the car.
The excess was therefore sent to the car. The positive green lines throughout the afternoon is energy being sent out of the inverter to what it thinks is the grid. It’s not because if it’s above 1.4kW the Zappi mops this up and sends it to the car instead.
The peaks at around 4pm were when Anna turned on the immersion heater once the generation from the panels was too low to go to the car. This meant that we used the surplus solar power to heat the water, along with some power from the battery. This was preferable to sending energy back to the grid, but once we have our Eddi installed we won’t need to do this as the excess solar will be sent to the immersion heater automatically and it will only take the excess so won’t draw from the battery.
The draw from the battery at around 5:30pm was cooking dinner and then we continued to draw energy from the battery throughout the evening. Unfortunately the battery was down to 10% by about 10:30pm which did mean that we had 1.5 hours of import from the grid. Had we had the Eddi in place and therefore not taken from the battery to heat the water earlier in the day then this wouldn’t have been the case.
Draw from the Grid
The draw from the grid isn’t shown on this graph (as it isn’t measured by the inverter). However we only imported 5.3kWh in total and most of that was overnight where the background usage is around 150-300 Watts. Overnight prices are currently 14.5p/kWh so that’s about £0.77 of electricity for the day. Not too bad.
I don’t think we’ll ever get to zero import from the grid thanks to the fact that certain things, the shower in particular, draw too much power. The inverter that controls the power from the solar panels and the battery has a maximum output of 3680Watts. The shower needs much more than this so the remainder will always come from the grid. Unless of course we have a ‘smelly day’!
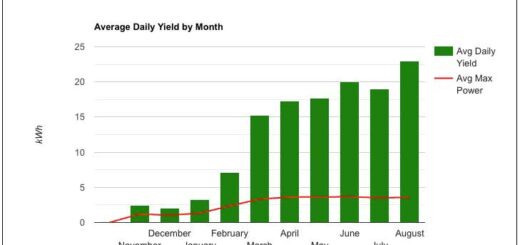
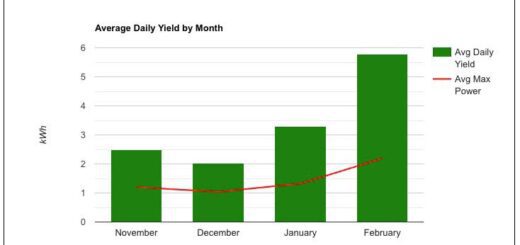
As would be expected, the average daily yield from the solar panels continues to improve as we move towards summer, as does the yield per month. I fixed the display of this within the plugin that I built yesterday and the improving trend looks good, so here are the charts of the average daily yield and the total yields by month again.
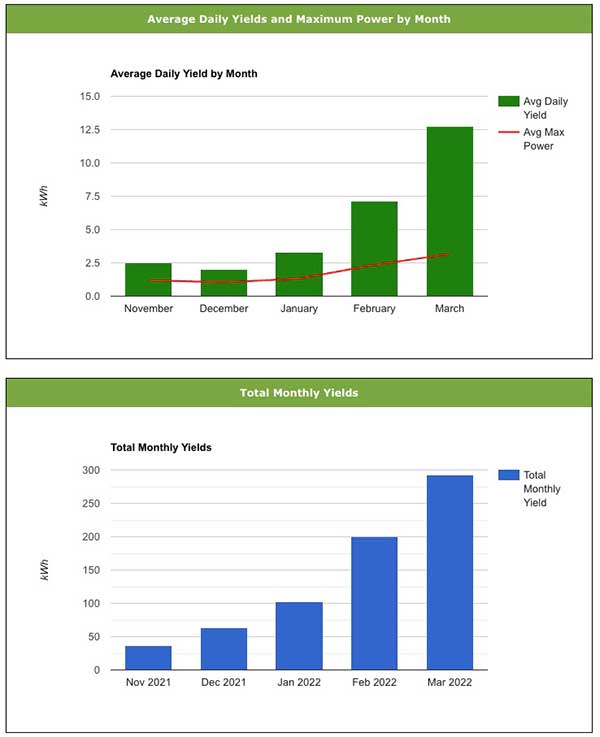
It’ll be interesting to see how the solar panels are performing in mid-summer. I wasn’t intending to write a blog post about the solar panels every week by the way, but thought I would this week seeing as we’ve turned off the heating and the force charging of the battery. The main reason though is because Laura complains if I don’t keep her updated on the latest from the solar panels!
Discover more from A Simple Life of Luxury
Subscribe to get the latest posts sent to your email.


Sounds good x