Frontier X ECG Monitor Review
The wonders of Facebook marketing managed to start advertising the Frontier X ECG device to me within hours of me returning home from hospital following my heart attack. Being something of a gadget hound and tech-lover my interest was of course piqued.
Frontier X
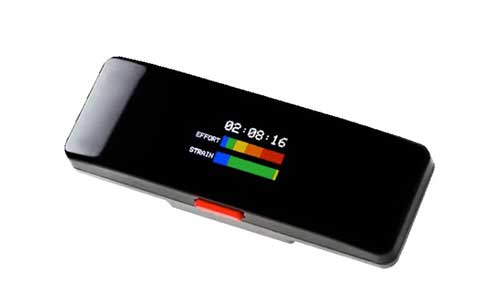
The Frontier X is a small, easy to use ECG device that you wear in the same way as a heart rate monitor chest strap. It allows you to record your ECG anytime, anywhere. That in itself sounds interesting, especially for someone recovering from a heart attack. It is also supported by the Fourth Frontier app which analyses the ECG and assesses your heart for abnormal rhythms and measures the strain on your heart. According to their marketing info this allows you to “exercise safely without overstraining your heart”. Perfect!
How it works – single lead ECG vs 12-lead ECG
Essentially the Frontier X records a single lead ECG trace that most closely resembles the output from the V5 lead of a conventional 12-lead ECG measurement.
In a conventional 12-lead ECG each of the leads measures the electrical activity within the heart from a different plane of view. This gives a good overall view of activity across the entire heart.
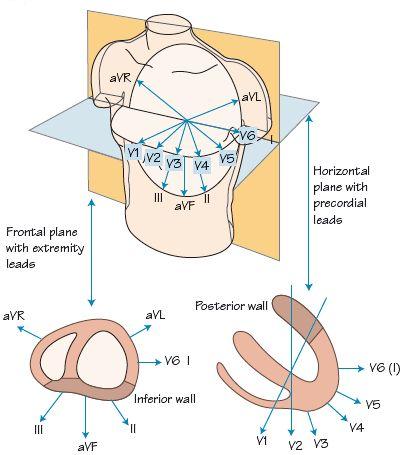
The single lead of the Frontier X only measures the electrical activity in one plane, similar to that of the V5 lead in the 12-lead view. This single plane provides much less information but does give an overview of the electrical activity within the heart and a fairly detailed view of the activity within the left ventricle. Clearly a single lead won’t provide anywhere near as much information but it does have several advantages over a full 12-lead ECG.
The first of these is the fact that it can be measured using a simple, unobtrusive chest strap with two electrodes in it rather than having 12 electrodes and various leads all over your body. Exercising with a chest strap on is no problem at all, doing so with a full 12-lead ECG set up isn’t quite so easy.
Secondly, for the lay-person, a simple, single lead ECG trace is easier to understand and interpret than the full view from 12-leads. It also makes it easier for computer algorithms to analyse. Even a simple, single lead ECG trace can still hold an incredible amount of information if you know how to read it and understand all of the nuances. I thought that a single lead ECG trace would be provide infinitely more information than no trace at all. A full 12 lead ECG would provide more data but possible more confusion too.
Trying it out
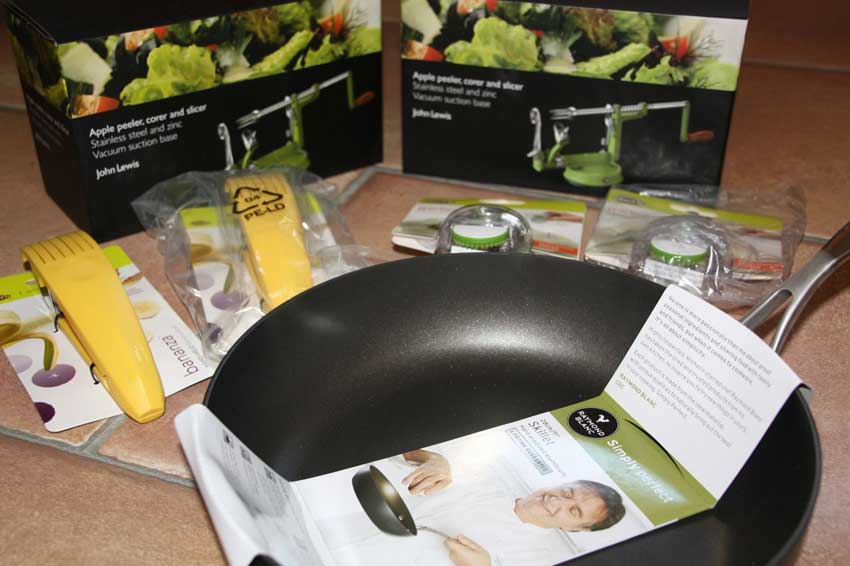
The device arrived last week, nicely packaged and charged ready to go. Set up was simple. I turned it on, paired it with the app on my phone and all was good to go.
- It can be used on its own by simply pressing the button on the device itself to start an activity / measurement. In this use mode all of the data is stored on the devices onboard memory and is uploaded to the app / cloud when you next pair with the app.
- It can be used paired to the mobile app by selecting an activity and pressing the start button on the app. In this mode you can see certain data ‘live’ on the phone screen. When you complete the activity the data is uploaded to the app / cloud.
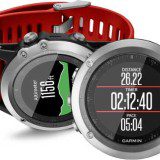
- Or it can be used paired to a watch such as my Garmin Fenix 6x by choosing an activity and pressing the start button. In this mode, heart rate data is visible on the Garmin device and the ECG data is stored on the onboard memory. The heart rate data is then uploaded to Garmin / Strava etc along with the activity data and the ECG data is uploaded to Fourth Frontier next time you sync with the app.
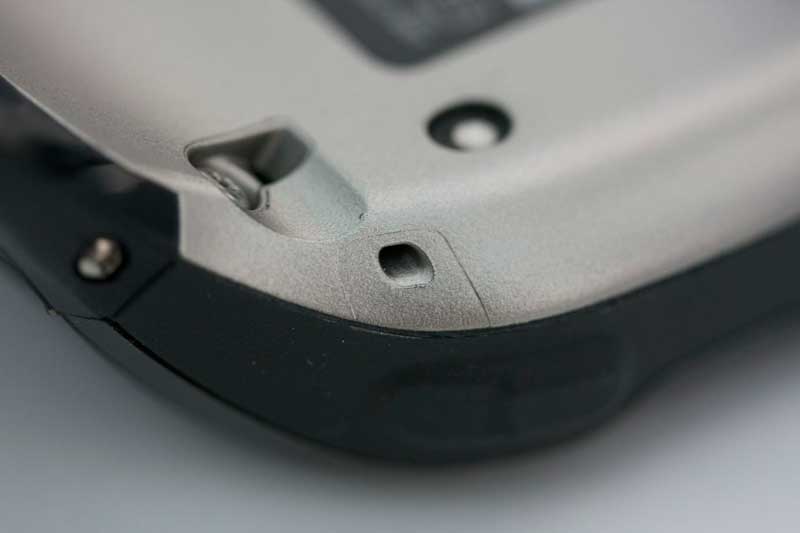
Wearing it is no different to wearing a Heart Rate Monitor strap. The device does have a nice colour LCD display on the front and some flashing lights on the top to tell you what it is doing. Whilst the screen is nice it’s also fairly pointless as you can’t see it whilst wearing the device. I’ve only done a few activities with it so far but the process of recording an activity and uploading it has all been easy and has worked as it should every time.
Fourth Frontier App
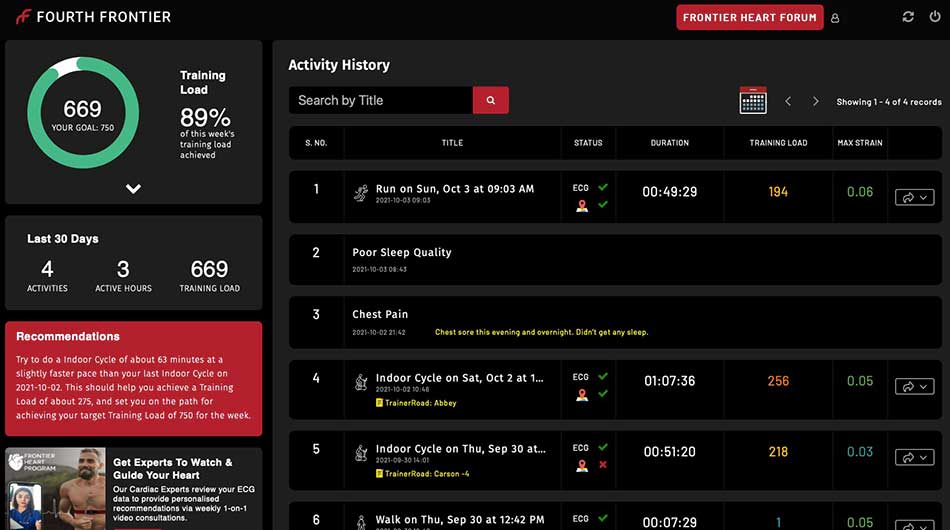
The app and online dashboard provide you with an overview of all your activities and allow you to delve into the details of your ECG trace during those activities. It also provides you with an overview of your training load over the past 30 days, and recommendations of what further training you should do.
The caveat to the training load overview is that you do of course need to be wearing your Frontier X device for all activities you do. It is waterproof and useable for swimming but keeping a chest strap in place whilst swimming isn’t so easy. I therefore haven’t used it for swimming activities yet. I might do so soon, but will have to wear a tri-suit over the top of the strap so as to keep it in place.
Clicking on one of the activities in your Fourth Frontier Dashboard allows you to view the ECG trace and some other information from the activity. This gives you a second by second (or should that be beat by beat) trace of your ECG along with graphs showing your heart rate, Cardiac Strain, QTc interval and breathing rate over the entire workout. If you are connected to a phone or GPS watch it will also show you things such as altitude, speed and a map of where you were. You can zoom into any section of the workout to view this information with better resolution.
ECG Trace
Here’s just a tiny section of an ECG trace measured by the Frontier X from a recent indoor bike ride I did.
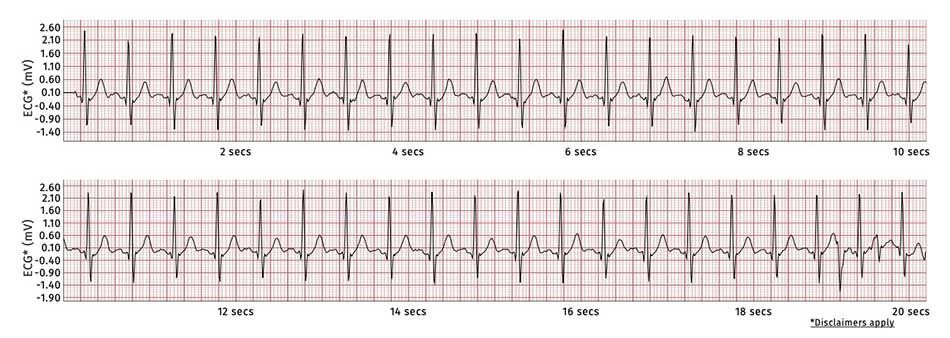
You are able to scroll through the entire workout to see the ECG trace for any portion of the activity and you can zoom into sections to see things in more detail too.
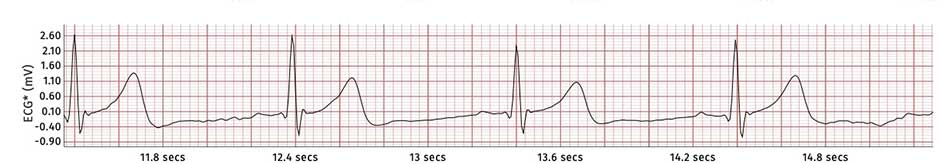
Considering the fact that I’ve recently had a heart attack, the traces above look remarkably normal to my untrained eye. I do have copies of ECG’s from during and immediately after my heart attack that look very different to these. In then have a another from 3 months after the heart attack in which the trace is returning to something closer to ‘normal’. I hoping that the traces from the Frontier X show that this improvement is continuing. I did of course get Anna to try it out too just to make sure it was actually recording an ECG and not just making it up! It’s always best to test such gadgets as you never really know what they are doing!
Here’s a comparison of a resting ECG trace measured by the Frontier X from me and Anna.


As you can see there are indeed some variations in the rhythms. My resting heart rate is lower than Anna’s so there are fewer beats per second but any normal heart rate monitor would tell us that. The amplitude of the electrical signals is also quite a bit larger in my trace (note the different vertical scales). I also have a much more pronounced T Wave. Other than that they are fairly similar. It’s good to see that there are differences as that reassures me that the Frontier X is actually recording an accurate rhythm strip. It’s also reassuring to see how close they are in many respects which shows that hopefully my heart is recovering well.
As a contrast, here’s a section from an ECG taken a day after my Heart Attack.
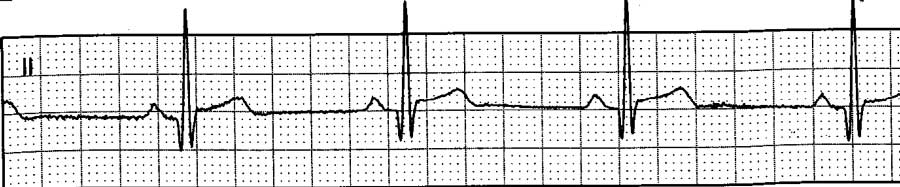
My knowledge of ECG traces is only that of a lay-person but the main differences you can see here are a deep Q-Wave indicating cardiac damage and elevation of the ST-segment which is indicative of a recent heart attack. There are of course many other nuances to ECG traces, especially a full 12-lead trace which contains a huge amount of information if you know how to read it. As I say, my knowledge is very limited but I am in the process of educating myself and furthering my knowledge with the excellent The ECG Made Easy text book.
Cardiac Strain
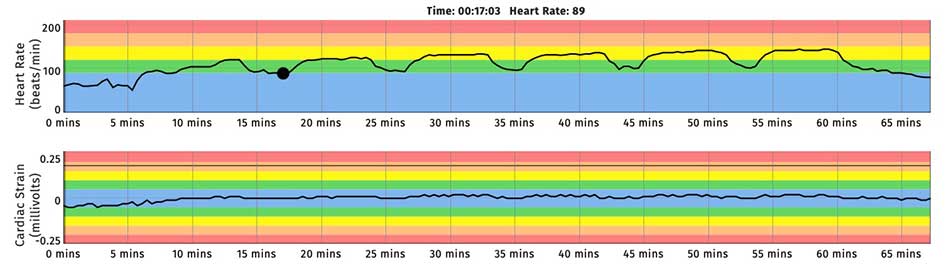
Below the ECG traces are graphs showing various other metrics. The first of these is your heart rate which is fairly self-explanatory. Below this is Cardiac Strain, which is described by Fourth Frontier as”
Cardiac Strain is a measurement of the oxygen supply to your heart muscles. Intense exercise can cause an increase in oxygen demand of the heart and result in cardiac strain. Cardiac strain greater than 0.2 mV may not be safe for the heart.
Fourth Frontier
This is essentially one of the main selling points of the device. By measuring cardiac strain the device is able to give you real-time feedback via a series of beeps should you be exceeding set limits. The default limit is 0.2mv, but for the sake of safety I have mine set to 0.18mv. So far I’ve only been doing relatively low intensity exercise as part of my recovery and thankfully haven’t come anywhere near this limit.
As with the ECG traces you can zoom in to view these graphs at better resolution within the website so as to see certain sections in more detail.
QTC Interval
Next is a graph of the QTc interval. This is explained as:
Corrected QT interval (QTc) is a detailed measurement of the electrical activity of the heart. Very high or low values of QTc may predispose you to a change in normal heart rhythm.
Fourth Frontier
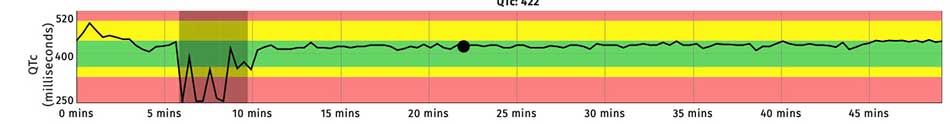
The QT interval is actually the time from the beginning of the QRS complex on an ECG trace, to the end of the T wave. Or in other words the time taken between ventricular depolarisation and ventricular repolarisation. A normal QTc interval is generally considered to be between 350 and 440ms.
Here’s a graph of my QTc interval during a run. Note: the greyed out bit between 6 and 10 minutes were shaded in by the Fourth Frontier algorithms to highlight areas of the graph where signal quality was poor. I’m therefore discounting the short QTc intervals reported here as recording errors. I was actually doing some high knee kicks and heel flicks as part of a warm up during this time so no doubt the jumping around meant there was poor contact between the electrodes and my skin. Otherwsie my QTc interval was within the generally accepted norms.
Other Data
The app also displays breathing rate, and cadence, and also speed and altitude. The latter two are only displayed if the device is connected to a phone or watch with GPS / barometer. There is also a map of your route displayed too.
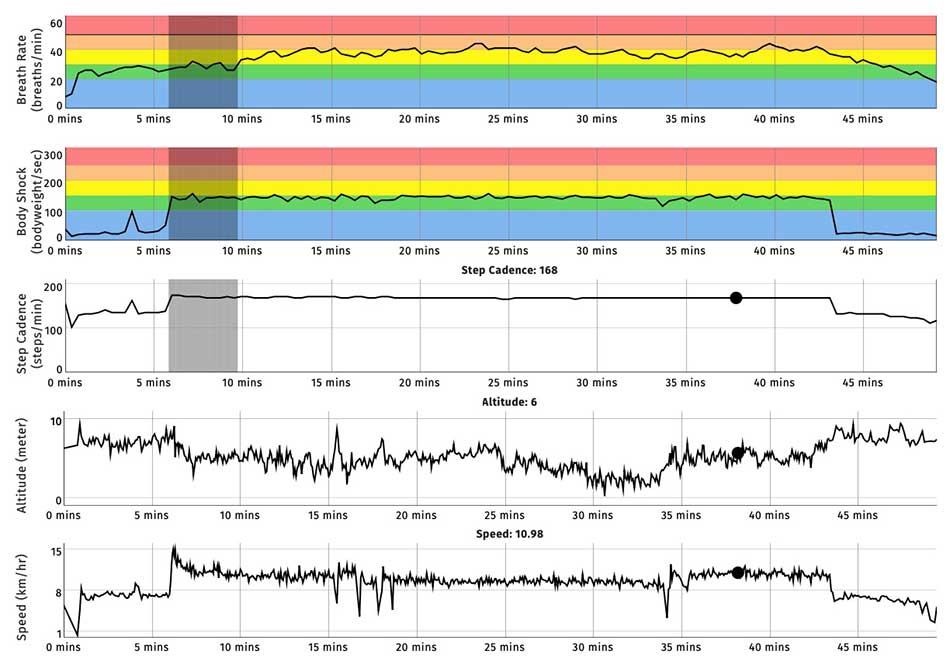
The data above was from a slow, easy run in the wind. There was a walking warm up and cool down at the beginning and end too. I was recording the run on my Garmin Fenix 6x so that data was uploaded to Strava as well. I hadn’t paired the Frontier X device with my watch though so the heart rates uploaded to Strava came from the wrist-based optical HR monitor on my watch which isn’t very accurate.
Conclusion
Overall I’ve been impressed with both the device itself and the app / website. The device is comfortable, well built and easy to use. The app and website present the data in a clear and easy to understand format. As expected it does seem to record an accurate single lead ECG rhythm trace.
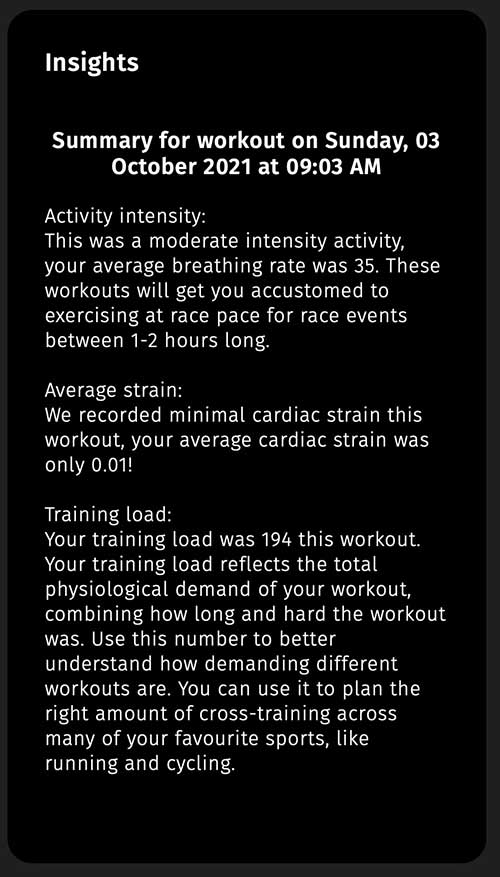
The usefulness of the trace is of course of debate but as someone who has recently had a heart attack, just knowing that the ECG trace is looking ‘normal’ and not going through any major changes when I exercise is somewhat reassuring. The ‘Insights’ provided by the web-based software aren’t really as much use as the manufacturers would make out as they are all pretty standard summaries of the raw data. See the box to the right for an example. There may be more interesting ‘Insights’ once I do more challenging workouts but I suspect they’ll all be fairly similar.
There are a few things missing that I would like to see as well. There doesn’t appear to be a way of uploading workouts that you have done without wearing the device to their system. I can see why this would be, but I’m unlikely to use the device whilst swimming (as it would mean wearing a trisuit so as to keep it in place). This means that activities done without the device can’t be added to the overall training load metric within the Fourth Frontier software so this metric will in many ways become meaningless. I understand that the ‘training load’ metric is based on the duration of each activity and the heart rate, breathing rate and cardiac strain recorded so the device is needed to record this. However, a simple algorithm based on just heart rate would be sufficient where the other data isn’t available. Using this in place of the full algorithm when necessary would allow other activities to be uploaded to the platform so that the training load metric could show a full picture of your training.
Another thing I would like to see is a ConnectIQ app / data-field for Garmin watches. This doesn’t have to be anything fancy, just a data-field showing the Cardiac Strain and the QTc interval. The Heart rate is already broadcast to a Garmin watch so that you can see heart rate on your watch whilst exercising. However, the only way to see live Cardiac Strain and QTc interval data whilst in the midst of an activity is within the app on your phone. It would be much nicer of you could see these extra two data points on your watch as well. This is especially true due to the fact that the device uses Bluetooth LE to connect to your phone or watch so can’t pair both the phone and the watch at the same time. You can of course see all of the data after the fact but it would be better if you could see it during an activity on your watch. There are after-all certain activities where carrying or looking at a phone just isn’t possible.
I’ll continue to use it of course and will report back any further findings once I start doing more intense exercise. I am still recovering from a heart atack though so won’t be rushing into such things, even if the Frontier X gives me the reassurance and peace of mind that it is safe to do so. I don’t think I’ll trust it quite enough to base increasing my exercise intensity on it. I will however back off if the data from it tells me to. Whilst it might give me some encouragement to push a little harder I think it’ll be safer to use it as a safety stop instead.
Fourth Frontier do also offer a paid for “Frontier Heart Program” where “Cardiologists, cardiac rehabilitation specialists & exercise physiologists review your ECG data to provide personalised recommendations via weekly 1-on-1 video consultations.” I haven’t signed up to this as it is quite expensive but I am supposed to get a one off free consultation as part of the purchase deal so I will at least try it out. I have contacted them to arrange it but have so far not heard back. I hope I do as it will be interesting to see what they have to say about my ECG traces so far.
Discover more from A Simple Life of Luxury
Subscribe to get the latest posts sent to your email.


I’ve also found this amazing ECG Interpretation course online. It’s worth it just for the diagrams but it is also well written, easy to understand and immensely detailed: https://ecgwaves.com/course/the-ecg-book/
Al.
Wow sounds amazing technology to me.
I’ve had this device for 2 months and it is great whilst running but it doesn’t work for swimming. I’ve tried everything including a tight tri-vest and all the data is greyed out which means it is inaccurate. Not one of my 25 swims has accurate data. I used the free consultation with the cardiologist but it was not any use as the data was greyed out so no assessment could made. Disappointing for a competitive swimmer who has recently had a stent fitted. Shame as I really like the device.
Same here, I have managed to get it working somewhat whilst swimming by:
1. Wearing it very tight.
2. Wearing a good fitting tri suit over the top of it.
3. Turning off bluetooth on any devices connected to it.
4. Only pushing off the wall fairly gently when turning.
It’s not great, there are still some greyed out areas but some parts of the session are Ok. It’s better than nothing but not really working for swimming for me either.
Al.