A Deeper Dive into the Rain
Hot on the heels of my updates to the temperature data page of the Borth & Ynyslas Weather Station, I’ve now added some features to the rainfall data page.
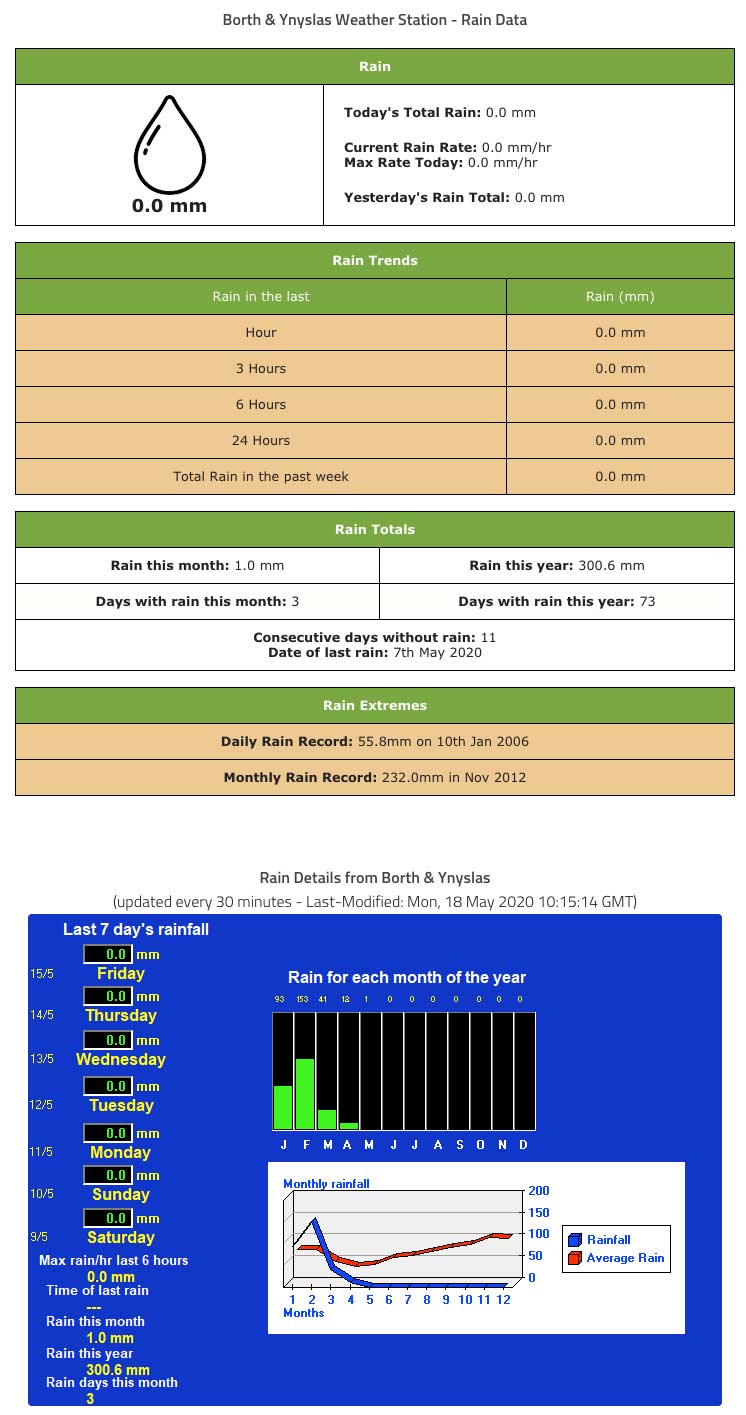
This is what the page looks like now.
Current Rainfall at Ynyslas
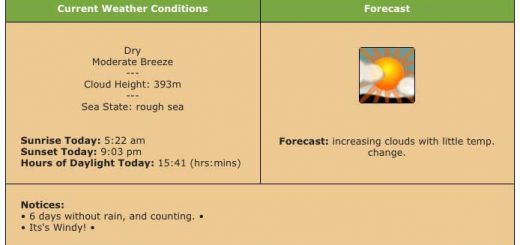
As with most of the detail pages of the weather station, it starts with the current conditions, showing
- The total rainfall for today.
- The current rate of rainfall.
- The maximum rate of rainfall today.
- Yesterday’s Total rainfall.
There are also two new data points in the section that only show if it has been raining or it is currently raining. If it is currently raining there will be an entry for the duration of the current rain episode. Similarly, if it has been raining that day there will be an entry showing the time of the last rainfall.
Rainfall Trends for Borth & Ynyslas
Below this are the rainfall trends over the past 24 hours. I have also added a new entry to show the total rain in the past week. As you can see, it’s been pretty dry recently!
Rainfall Totals for Ynyslas
The next section shows some rainfall totals data with:
- Total rainfall so far this month.
- Total rainfall so far this year.
- The number of days with rain so far this year.
- The number of days with rain so far this year.
It also shows the consecutive days without rain and a new bit of data showing the date of the last rain.
Extreme Rainfall Events
Next are a couple of rainfall records for Borth & Ynyslas in the form of the wettest day on record and the wettest month on record. Not much has changed here except for the fact that I have formatted the dates in a nicer fashion.
Rainfall chart
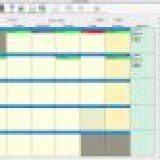
Finally there is a graphic that gets updated every half an hour that shows a number of items. Some of these items are the same as in the boxes above but it also shows the rainfall totals for each of the past 7 days.
The bar chart with the green columns shows the total rainfall for each month of the year so far. As you can see, January was probably a fairly average month with around 93mm of rain, February however was particularly wet with 153mm whereas March, April and (so far) May have been unusually dry.
Below this is a line-chart that compares this years monthly rain with that of the average monthly rain since records began. This line-chart not only allows you to compare this month with the averages but also shows you how the rainfall averages out across the course of a year with November and December currently being the wettest months on average and April and May being the driest.
Discover more from A Simple Life of Luxury
Subscribe to get the latest posts sent to your email.