Improving My Solax WordPress Plugin — Adapting to a More Dynamic Charging Schedule
Back in November 2021, I wrote a post about how I built my own Solax WordPress plugin to display data from our inverter in real-time. It worked extremely well for years, and for our setup at the time it gave an accurate picture of our solar production.
However, towards the end of 2025 we added an additional battery and switched to a new, far more flexible ‘intelligent’ energy tariff. Unlike our old tariff — which force-charged the battery only once per night during Economy 7 times — the new tariff will now:
- Have cheap rate between 11:30 p.m. and 5:30 a.m
- Have dynamic cheap rate periods during the day, allowing us to perform short opportunistic top-ups,
- Might, in the future, occasionally schedule charge windows based on grid conditions.
This meant our battery charging behaviour was suddenly much less predictable, and that’s when the numbers in my plugin started to drift away from those shown in the Solax app and away from reality.
The original method — worked well when charge cycles were predictable
The easiest way to show the PV-only yield would be to get it from the Solax API. It is shown in graphs in the Solax app, but unfortunately this figure isn’t exposed in the API. The API only shows the inverter yield, which includes everything that comes out of the inverter. This includes any energy we had stored in the battery via force-charging from the grid – not what I wanted. So, I devised a calculation that attempted to take the energy we had put into the battery from the grid, and subtract it from the inverter yield, to give a PV-only yield.
When our battery was charged only once per night and between fixed hours, this logic worked reliably. The assumptions were simple:
- Overnight State-of-Charge (SoC) increased predictably from force-charging (if force charging was on).
- Morning SoC declined predictably until the sun came up,
- The “forced-charged” energy was relatively easy to isolate mathematically.
- Any battery discharge early in the day came almost entirely from grid origin energy.
- Solar PV contributions began only when the panels started generating.
Under these conditions, calculating “how much of today’s inverter output came from grid-charged battery discharge” was relatively straightforward — and for several years, it tracked the Solax PV-only figure reasonably well.
Why the new intelligent tariff broke the model
When we switched to a more dynamic tariff, the force-charge schedule stopped being a neat 7 hour block. This unpredictability introduced more complexity and with charge periods spanning across midnight and energy flowing in all directions the figures I was seeing were no longer correct. I think they always had small margins of erro, but the extra battery storage just magnified this and I was no longer happy with it. I stepped back and asked a better question: “Why am I trying to infer PV generation from battery behaviour at all?”
The obvious answer — measure PV at the source
The Solax API does expose the instantaneous power coming into the inverter from the solar panels. In fact, the reason that PV-only yield isn’t exposed in the API is because the API only shows actual measurements being made. PV-output isn’t one of these measuerments so the number in the Solax App for this is a calculated figure anyway.
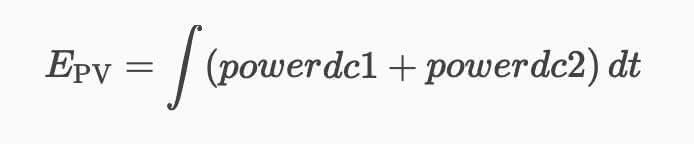
The API does show DC-power direct from the solar panels via the two DC inputs on the inverter:
powerdc1 + powerdc2
These reflect actual solar panel output at any one time, independent of:
- battery charge/discharge
- inverter efficiency
- house demand
- grid exports/imports
- tariffs or force-charge schedules
So the right solution isn’t to make the SoC model more complicated. It’s to stop using the battery entirely for PV-only yield.
If I want to know how much energy the panels produced, I integrate the panel power:
The new method — trapezoidal integration of DC panel power
My plugin runs every 5 minutes, so I now do the following:
- Read PV power: pv_power_now = powerdc1 + powerdc2.
- Look up the last PV power and timestamp.
- Compute energy for the 5 minute interval using the following trapezoidal rule:
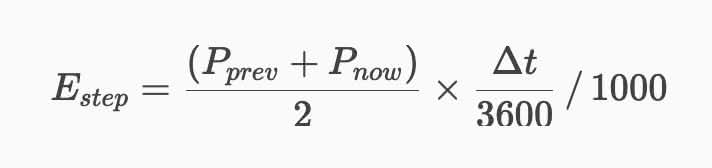
- Add this figure to the running ‘yield_today’ figure.
This method:
- is mathematically correct,
- is robust to tariff changes,
- is immune to charge/discharge cycles,
- handles gaps in data gracefully,
- and matches the Solax app within a percent or two.
Most importantly, No battery logic is needed, no State-of-Charge figures are needed, there are no round-trip efficiency assumptions. It’s just pure PV power.
Why this solves all of the old problems
- Works regardless of how often or when the battery force-charges: Tariff can change every day — yield still correct.
- Multiple batteries? No issue: The number of batteries no longer affects the calculation.
- No efficiency tuning required: Because PV yield is DC-side energy, not AC. There might be slight loses when converting from DC to AC, but the DC energy is the actual yiled from the solar panels. I can if I decide quite easily tweak this with a calibration coefficient if I wish.
- Much smoother and closer to Solax’s own numbers: The PV curve matches reality instead of battery behaviour.
- Gap tolerant: If the server misses an hour, the math still works.
- Flexible: If we add more panels or move strings, the yield still works.
Tweaks for Efficiencies and Clamping
Having experimented with this for a few days I found that it needed some tweaking. This is because inverters aren’t 100% efficient. This led me down a deep rabbit hole of how inverters actually work and when they are and aren’t efficient. It turns out that their efficiency depends on a number of factors that change each day and change according to the amount of power going into them. At higher watts they have quite high efficiency, in the range of 98-99% when converting from DC to AC, but as the watts drops this can become much lower. Once below a certain threshold the AC output essentially becomes zero as the conversion efficiency is so poor. Other things that happen within the inverter such as the stability of the PV output also affect the variation between DC-power coming in and AC-yield coming out. Rather than model this exactly, which wouldn’t be easy to do I’ve decided to simplify things with:
- A single ‘efficiency calibration‘ figure.
- A variable ‘Low-end clamping‘ figure that reduces the efficiency as the wattage decreases, essentially resulting in zero yield once DC-power drops below 40 W.
It’s likely that I’ll add an efficiency calibration of around 96%. This will essentially multiply all 5 minute interval energy segments by 0.96 to account for losses in the system. The low-end clamp figure will be a further reductioin in efficiency once power drop below a certain level. It consists of a couple of jumps of reducing efficiency from 200 W down to 40 W.
I’ll monitor things over the next few days/weeks to see just how well these track the Solax numbers and will tweak them accordingly. At the moment they are quite cose, but that may change once the days get longer and brighter but I now have ‘dials’ I can tweak if needed.
Potential Problems
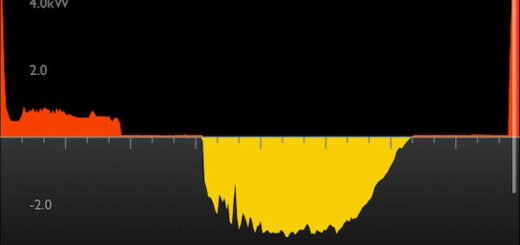
Not all solutions are completely error-free and this one does still have a few potential problems. The polling rate is once every five minutes, and the Solax Dongle only uploads data once every five minutes as well. The figures I’m using are the instantaneous power readings from the panels, not the total energy generated from them, so I am assuming that things change in a linear fashion between tthe two polling points.
If it was perfectly sunny at the previous reading and perfectly sunny 5 minutes later then the average of those two measurements works OK. But if a dark cloud came over just after the first measurement and then moved away just before the second measurement that temporary dip in power generation that it caused wouldn’t be recorded.
Ideally the resolution would be higher as a lot can happen in 5 minutes, but that is outside of my control. The hope is that over the course of a day, months and years these temporary changes will even themselves out and the averages will be pretty close to reality. Sometimes they’ll measure slightly high, other times slightly low, but overall the resulting yield will be accurate.
Any downtime might skew results as well – again, the fact that I’m averaging between the two polling points should mean that such things are handled well and the system is fairly tolerant of gaps in recording, but these will only decrease the resolution from time to time which might introduce small inaccuracies.
Conclusion — a cleaner, more robust system
The original method worked well under our old tariff because battery charge/discharge patterns were rigid and predictable. But once the system became more dynamic, it became clear that trying to infer PV output by subtracting grid charged battery power from the total inverter yield was asking for trouble.
The new trapezoidal PV-integration method is:
- simpler
- more accurate
- more robust
- easier to maintain
- and will hopefully match actual PV-only yield extremely closely
I’ll monitor it for a while to make sure the new method works as expected. I’ve also gone back and have updated the somewhat erroneous readings over the past few months – I want my data to be as accurate as possible, so a little manual updating was worth it to keep my records up to date.
It’s all a bit geeky and not really necessary, but it keeps me busy, and I learn things along the way. The Solar Generation readings on this site are currently using these new calculation methods and updated records.
Discover more from A Simple Life of Luxury
Subscribe to get the latest posts sent to your email.