Solar Comparisons
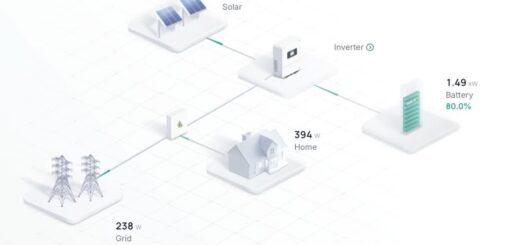
I’ve added some new data features to my Solax Solar Panel Plugin for WordPress. This plugin isn’t publicly available for a few reasons, but I use it on this website to display the status of our solar panels and track their performance over time. It’s also used on a small Home Info-Display, which shows data from our Borth & Ynyslas Weather Station, along with tide times, sunrise and sunset times, and more.
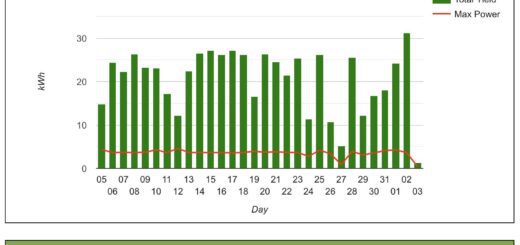
The newest additions allow us to compare solar panel yields for the Month-to-Date and Year-to-Date.
Month-to-Date Comparisons
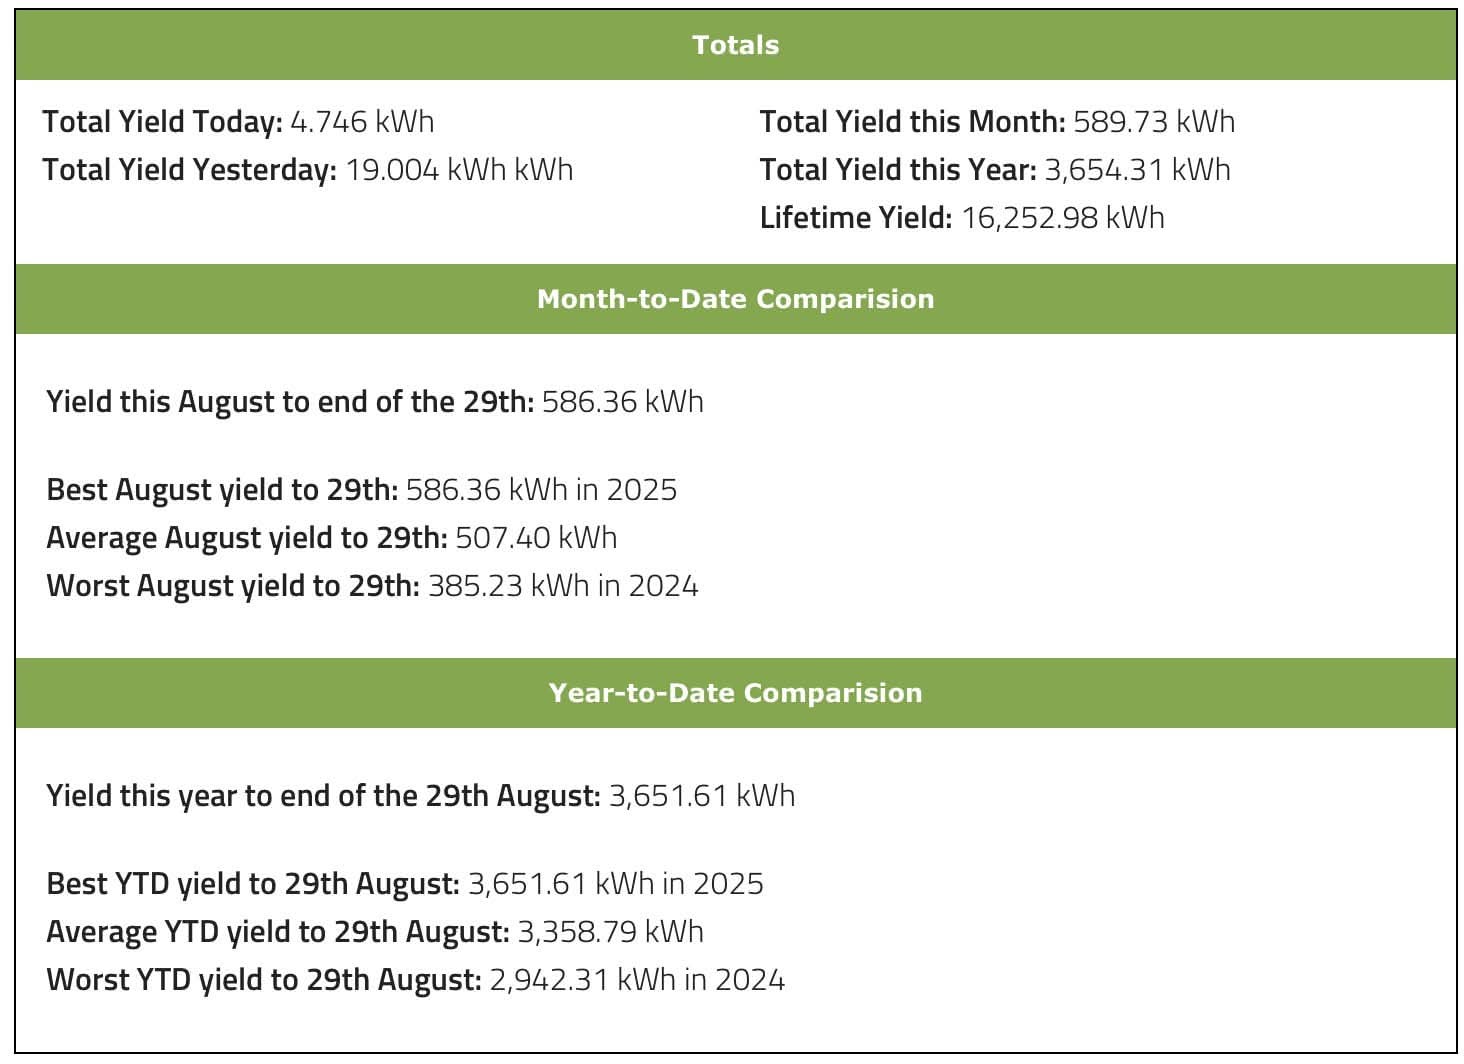
So far, August 2025 has been our best August yet. I take data only up until the end of the previous day to ensure we’re comparing full days. With just over 586 kWh produced by the 29th, this August is above the average of 507.40 kWh for this point in the month, and far above the lowest August on record—365.23 kWh in 2024.
Year-to-Date Comparisons
The Year-to-Date comparison works the same way. By the end of August, the average production by this time of year is usually 3,358.79 kWh, with 2024 being the lowest at 2,942.31 kWh. In 2025, we’ve already reached 3,651.61 kWh, breaking previous records.
All of this data is not only interesting but also useful too. It helps us monitor performance year by year and might even allow us to track any degradation of the panels over time.
Discover more from A Simple Life of Luxury
Subscribe to get the latest posts sent to your email.