A Year of Solar
We’ve had just about a year of solar generation now. Time to take a look at the stats. That’s easy to do thanks to the solar stats pages I built on this website.
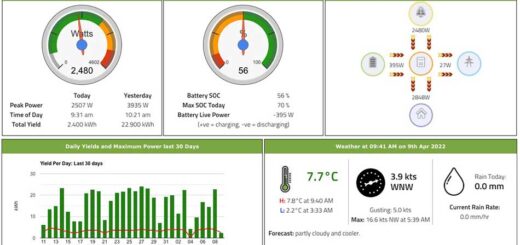
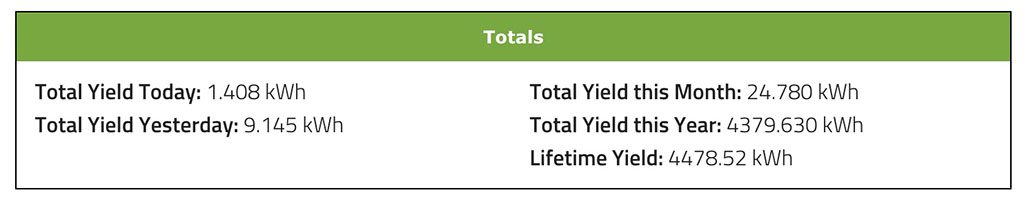
The solar generation overview page shows today’s solar generation, along with some charts of generation over the past month, and some totals. Looking today we can see that the lifetime yield (which also equates to about a year’s worth of solar) is 4478.52kWh. It’s actually slightly less than a year as the panels didn’t go live until November 9th and I didn’t start recording properly until a little later in the month when I built the app to do so.
That’s not too bad. 4.5 Megawatt hours of electricity is quite a bit, and of course, equates to quite a saving on our electricity bill
Records and Averages
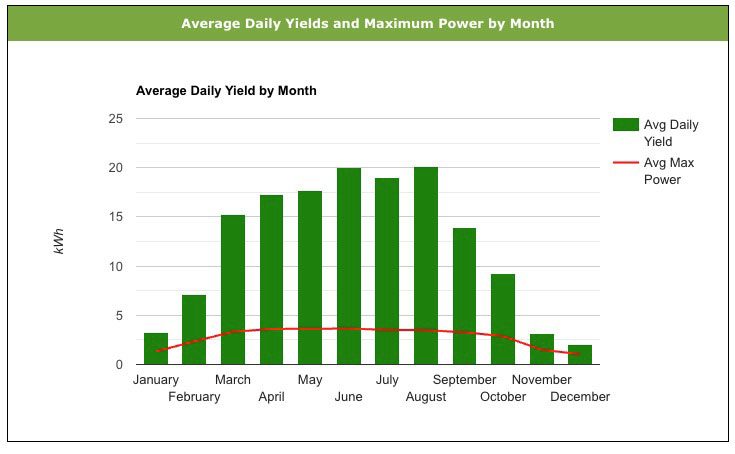
The Solar Generation Records and Averages Page shows a breakdown of our generation over the year. The first chart shows the average daily yield per month. As expected it’s higher in the summer than the winter and follows a nice pattern throughout the year.
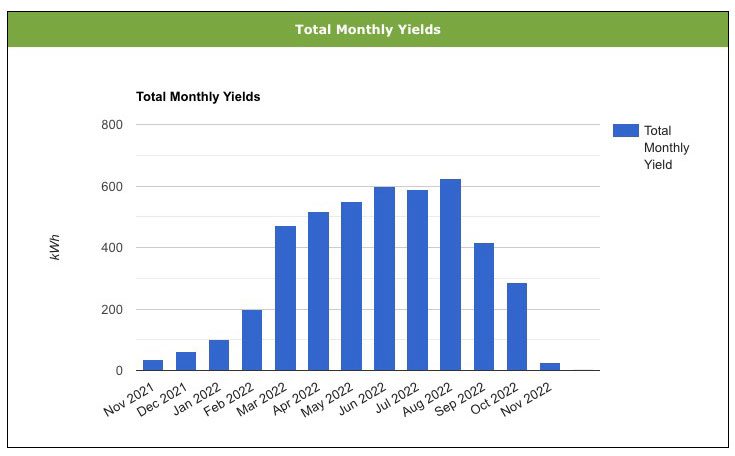
The next chart on the page shows the total yield per month. Again, this obviously follows the same pattern but has an even more pronounced seasonal variation as it’s showing total yield rather than average daily yield.
I guess all of this means that I’ll have to start adding some historical data to the app as well so that we can compare such data year on year. No need to do that yet, but I’ll start work on it soon. I should have some time during the dark days of winter, I just might not have the electricity to run my computer!
Discover more from A Simple Life of Luxury
Subscribe to get the latest posts sent to your email.