More Solar Statistics
I know I finished my last post by saying that I might like to add some features to the solar panel monitoring pages on this site and that it would probably be a project for the long dark winter. But once the seed was planted, I couldn’t help but get on with it. And with the help of AI, it was actually a lot quicker than it would have been had I been typing all of the code myself.
So, the Solar Monitoring pages now have a Solar Statistics page which shows a Daily View for each month since we had our solar panels. This page shows the:
- Amount of solar power generated each day
- The Peak power output for each day
- The generating period each day.
There is also a Monthly View which shows each month of a given year and the:
- Amount generated
- Average Daily Yield
- The amount generated on the best day of that month,
- The peak power
- The number of days where nothing was generated
Finally, there is an Annual View as well, showing:
- The total generated that year,
- The Average Daily Yield
- The amount generated on the best day of the year
- The Peak Power
- The % change that year
- The number of zero days
Once I’d built this, I thought it would be nice to show the extremes in each of the tables as well, so most columns (where appropriate) have little High or Low markers to show the extremes for the given view.
Obviously, the extreme lows only apply to full days/months/years, as at the beginning of any given day, month or year the current period would always be the lowest, so they are excluded from this metric.
All seems to be working so far, and it highlights some nice data and interesting trends.
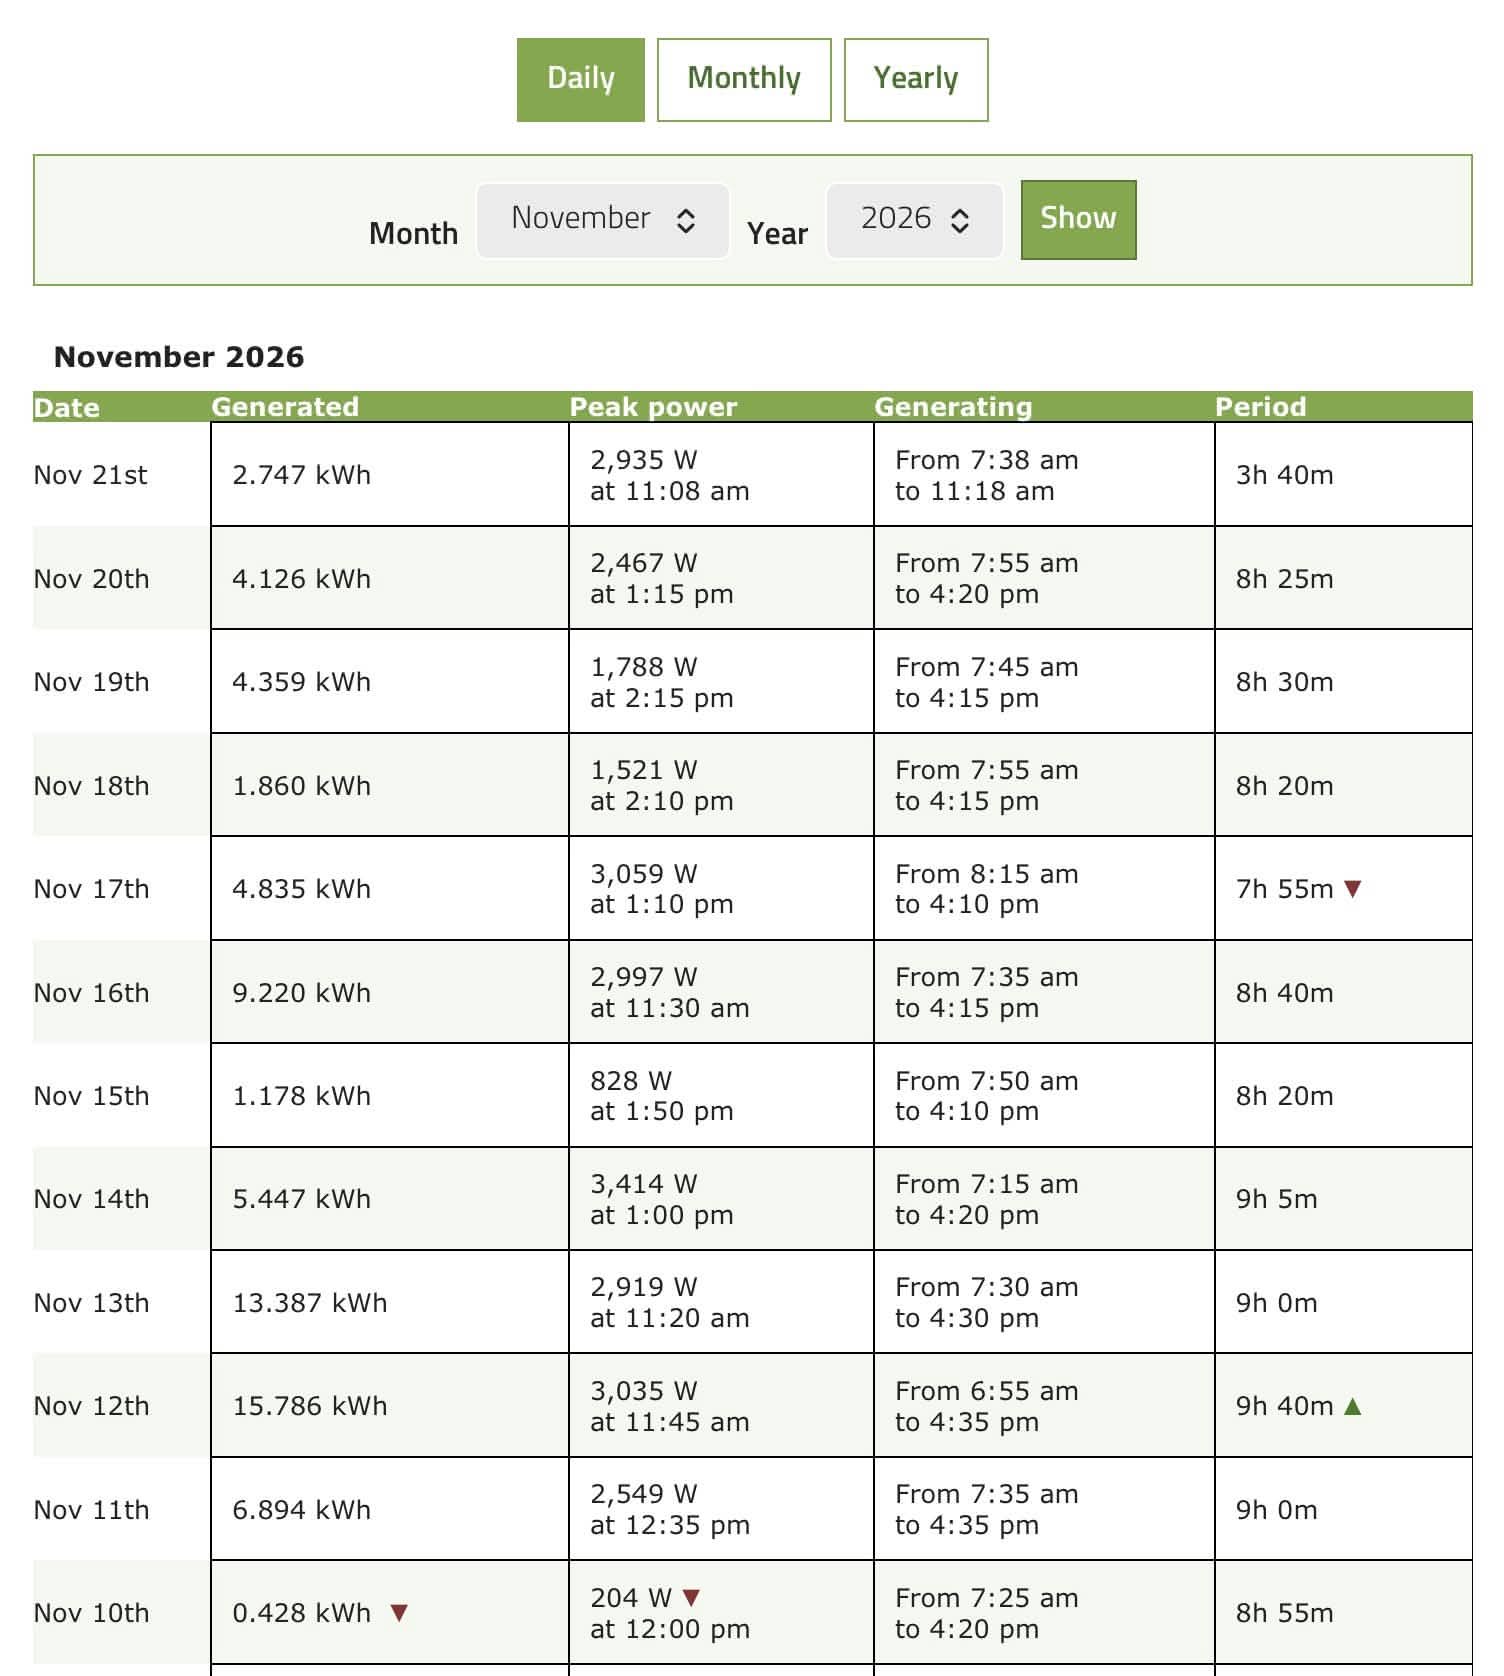
I guess the next obvious improvement will be to make the tables user-sortable; that should keep me and my AI busy for a while.
An extra Bonus
I’ve also added a little system-check feature to the main page of the solar monitoring section as well. Being the scenes there is a little more data just for me, but on the public facing page it just shows how fresh the data is.

Not really necessary, but I just fancied adding it. Hopefully the coloured dot will be green whenever anyone looks at it, but it will go through a series of yellow, orange and red if, for some reason the data isn’t flowing through to the display in the way it should.
Discover more from A Simple Life of Luxury
Subscribe to get the latest posts sent to your email.











Columns are now sortable!
Also, I’ve added nice animated charts to each page and have added a monthly overview chart as well showing how yield varies month by month over each year.
Enjoy!!