Weather Station Updates
I’ve been making some changes to the Borth & Ynyslas Weather Station pages lately. So, this is what’s new.
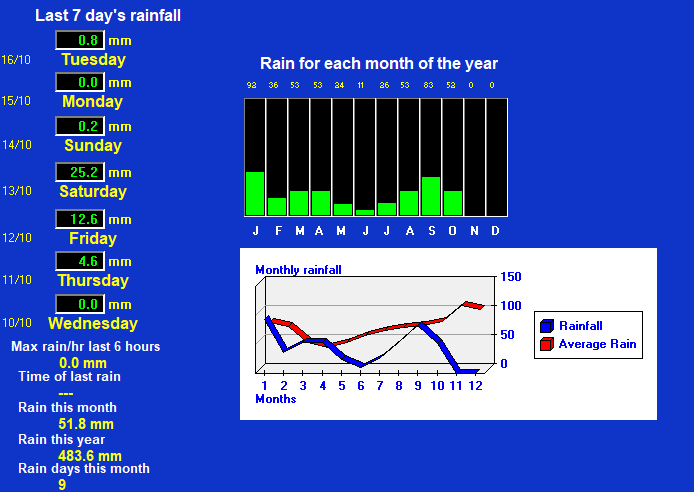
Rainfall Data
The dry weather early in the year made me realise that the rainfall data that is presented on the weather station pages was a little lacking in detail. In my defence there was a good reason for this. The weather station was initially set up for use by windsurfers and kitesurfers so understandably concentrated on the wind. We didn’t care if it was raining or not we just wanted to know how windy it was. There’s no reason why the weather station can’t be used by other people as well though so I added a rainfall data page. This shows various rainfall details:
- Current rain rain
- Today’s total rainfall
- Yesterday’s Rainfall
- Trends in rainfall over the past 24 hours
- Rainfall totals for the month and year
- Days with rain for the month and year
- Consecutive days without rain
- and some rain extremes
There’s also a nice little graph showing the rainfall totals for each month of the year and how this compares to the average since recording began back in 2005.
Rain Detail Charts
Weather Ticker Feature
I’ve also added a little ‘weather ticker’ feature that highlights certain weather parameters as they are happening. I’ll add to this as time progresses and I think of new things to highlight but it should pop up when things are particularly windy, particularly hot, particularly cold or we are breaking any records. It’ll even highlight dry periods and heavy rain so there should be something popping up in the ticker from time to time. If the weather isn’t up to much then it won’t show at all.
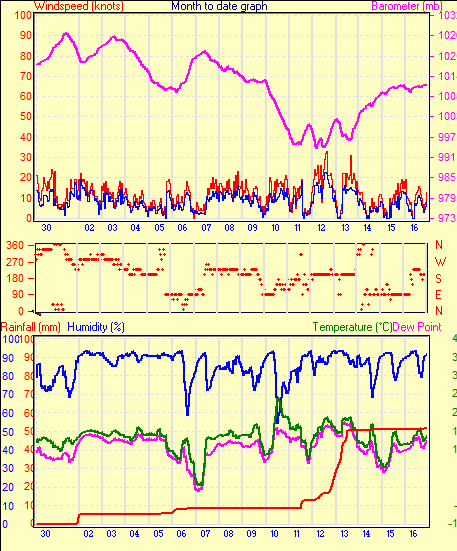
Historic Data
There has always been a section dedicated to Historic Data from the Borth & Ynyslas Weather Station. This allows you to select any month since the station started recording data and see the averages / extremes for each day of that month and also the averages and extremes for the entire month in question. I’ve now added a couple of graphs to the main Historic Data page that show the trends over the past week and the trends for the month to date. These graphs show the trends in:
- Temperature
- Humidity
- Pressure
- Wind Speed
- Wind Direction
- Gust Speed
- Rainfall
- Dew Point
-

- Month to Date Chart
-
- Weekly Chart
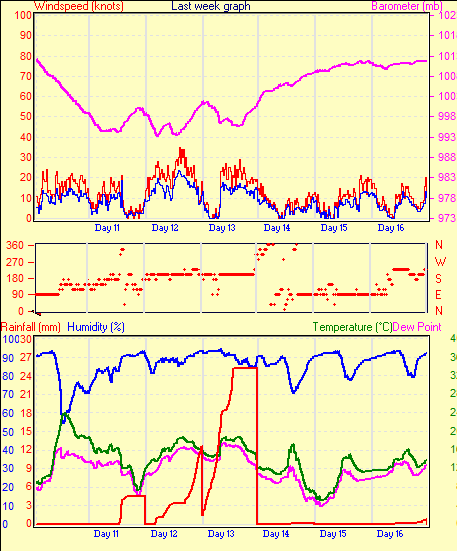
Image updates and Caching
Whilst working on the weather station pages I did note that some of the images (such as those for the historic data charts) were being cached a little too aggressively by browsers and therefore weren’t updating in a timely fashion. Each of the charts and graphs displayed on the weather station pages are updated at different intervals. Some need updating every minute. Those showing trends only need updating once an hour or every three hours, and those which only show things that change daily are only updated at midnight each day. Browsers were however caching these image files and therefore not always loading the latest version. As the names of the image files don’t change when they are updated the browser was loading them from cached files rather than the new ones that had been uploaded to the server. I’ve fixed this as well. It was simple fix. I’ve just appended the file creation timestamp as a query to the files URL. This is enough to make the browser realise that the file has changed as it now has a different name and therefore reloads the image from the server rather than using the cached file.
As always, there is a small charge for people to access the weather station pages (£20 per year). It isn’t going to make me rich – in fact it doesn’t even pay anywhere near enough to cover the costs of maintaining the station. Being exposed to the environment here in Ynyslas means that it takes quite a battering from the elements and various parts need replacing from time to time. The anemometer and Integrated Sensor Suite take the brunt of this punishment, but there is also a data logger and a computer that needs updating, not to mention the cost of electricity to run it and hosting costs to keep the data live on the web. It’s updated every minute of every day as well so that takes up quite a bit of bandwidth. The money I get from subscriptions only covers a fraction of this so please do subscribe and help keep it going if you find it interesting. Don’t worry, I don’t mind paying to keep it running as I like having it myself, but every little helps and it would be good to share the data with more subscribers.
I know I can look out of the window to see what the weather is doing but having actual data is always nice, and the weather here is pretty interesting!