Ramp Test and DXA Scan
As regular readers of this weblog will know, I often volunteer as a participant in various studies at the Sports and Exercise Department at Aberystwyth University. Most of these require a fair bit of my time to do but often prove interesting and painful in equal measure. Interesting from a point of view of getting a measure on my level of fitness at any given time, ‘painful’ thanks to the disgusting supplements, horrible exercise regimes – sometimes in heat chambers or unusual positions – ramp tests, regular blood sampling, rectal thermometry and other unpleasantries!
I’ve recently agreed to participate in a new study which doesn’t sound too bad. The research student is investigating the variations in body composition and bone density during a competitive cyclists season. Earlier research has shown that adult male cyclists have lower bone mineral density than age-matched controls.
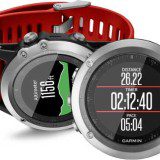
All I have to do for this test is lie down on one of the departments more expensive machines, a DXA scanner, so that such parameters can be measured. I also have to do a ramp test. I’m not sure what the results of the ramp test are used for in the study it may just be an ‘incentive’ to get athletes to participate as the test gives them a good measure of their current fitness and can provide data such as VO2 Max numbers, Lactate Threshold Heart Rate and Functional Threshold Power – All useful tools for working out training zones.
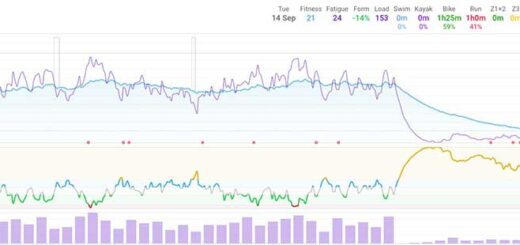
I did the first of my sessions earlier in the week, starting with the DXA scan which was interesting. I’ve never had one of these before so was keen to see the results. I also did the ramp test which was as hard as usual but not too bad. My results from the ramp test were about average and kind of where I expected them to be. My peak power 363 Watts which was higher than last time when I only hit 348 Wats but nowhere near the maximum I have achieved of 395 Watts. Vo2Max was right where I expected it to be at just over 59ml/(kg·min).
DXA Scanning
Dual-energy X-ray absorptiometry (DXA, previously DEXA) is a means of measuring bone mineral density (BMD) and is typically used to diagnose osteoporosis. The scanner works by firing two X-ray beams with different energy levels at the patient’s bones. This allows the BMD to be determined from the variation in absorption of each beam.
Bone Mineral Density refers to the amount of mineral matter per square centimeter of bones and can be used as an indirect indicator of osteoporosis and fracture risk. Results are often reported in 3 terms:
- Measured areal density in g/cm2
- Z-score, the number of standard deviations above or below the mean for the patient’s age, sex and ethnicity
- T-score, the number of standard deviations above or below the mean for a healthy 30 year old adult of the same sex and ethnicity as the patient
T-Scores and Z-Scores
Whilst you might think that the Z-score is one of the more important numbers to look at as this compares your bone density to that of other people of similar age and gender, it’s actually the T-score that is more indicative of problems such as osteoporosis or fracture risk. Bone density tends to peak at around age 30 and then often decreases with age. Although it might be nice to have average or higher than average bone density for people of similar age, that isn’t actually much use to you if most people your age are at risk of fractures. It’s more useful to compare your bone density to that of peak bone density because at the end of the day the best way to prevent issues such as osteoporosis and fractures is to try to maintain the bone density of a 30 year old. The T-score is therefore the relevant measure when screening for problems such as osteoporosis.
- Normal is a T-score of -1.0 or higher
- Osteopenia is defined as between -1.0 and -2.5
- Osteoporosis is defined as -2.5 or lower, meaning a bone density that is two and a half standard deviations below the mean of a thirty-year-old man/woman.
Whole Body Scan Results
My whole body scan shows some positive results. My overall Bone Mineral Density was 1.158g/cm2 giving me a T-Score of -0.4. This puts me up in the normal range, which considering the fact that I am 44 and not 30 years old is actually quite good. So all is good there.
The whole body scan is actually broken down to show results for 10 different body regions:
- Left Arm
- Right Arm
- Left Ribs
- Right Ribs
- Thoracic Spine
- Lumbar Spine
- Pelvis
- Right Leg
- Left Leg
- Head
This can be used to identify any problem areas or any imbalances. Looking at my results, my ribs and spine seem quite low as far as BMD is concerned, more on this in a mo.
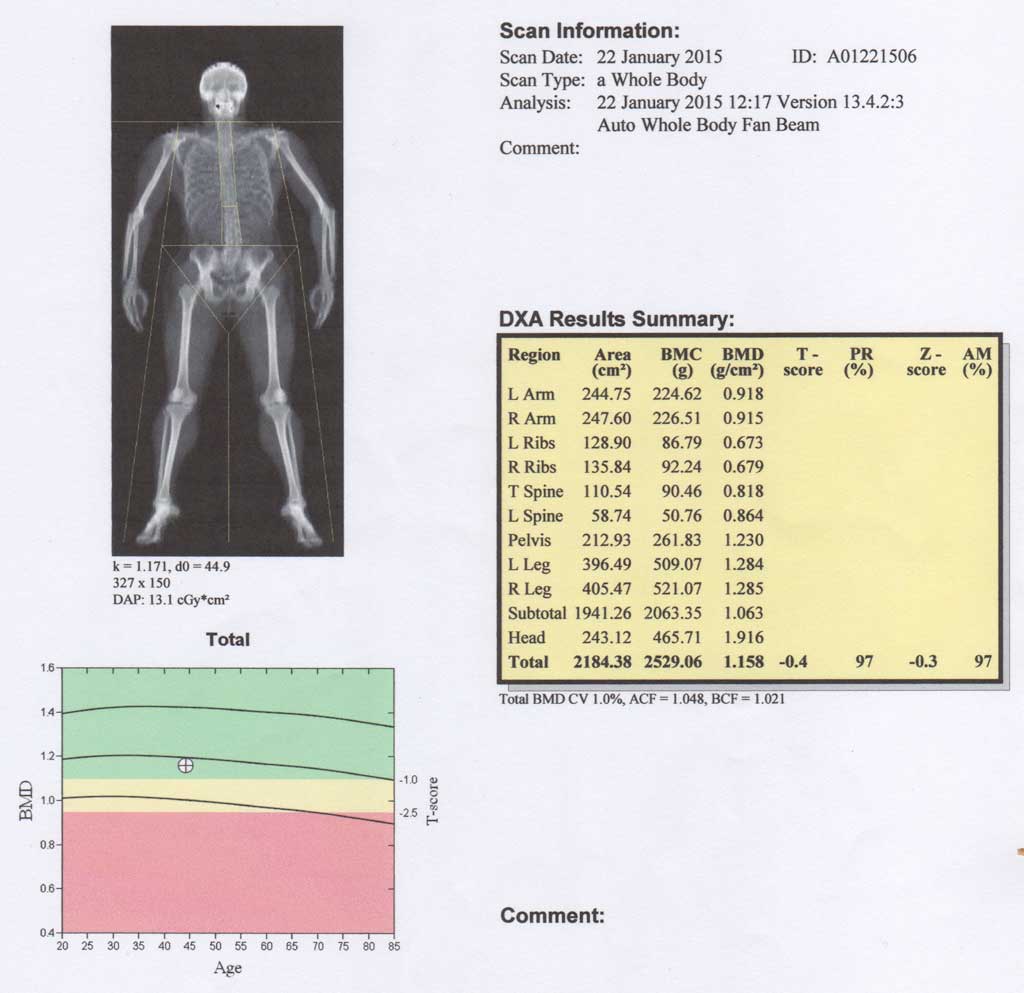
DXA Scan Results – Whole Body
Most people will of course show a fairly marked imbalance from left to right depending on which are their dominant limbs. I’m actually very well balanced in this respect though. The Area and BMC (Bone Mineral Content) are the numbers you need to look at to compare here as these give you the actual area and weight of the various parts of your body. As you can see from the results, my right arm, right leg and right ribs are all slightly larger than the left side but the differences here are smaller than usual. I must be a very well balanced person!
Body Composition – Fatty!
The whole body scan can also be used to measure overall body composition as well as bone mineral density. This allows you to see how much lean mass and how much body fat you have. Now, I’m about 7kg overweight at the moment (based on what I’d like to be) and therefore carrying much more body fat than I should be. Hopefully this scan and the fact that I have another one lined up in a couple of months will do two things.
- Shame me into losing the necessary weight once I see the body fat % numbers.
- Encourage me to lose the weight so that I can see better numbers next time.
Here are the results, and as you can see at 19.5% body fat they don’t make pretty reading!
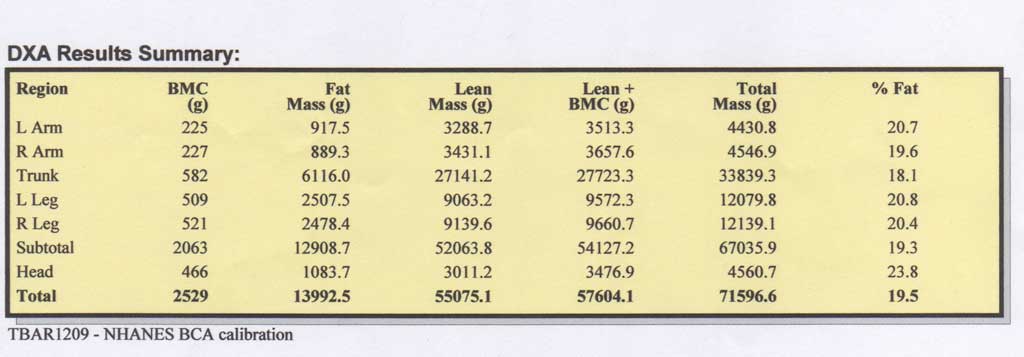
DXA Scan Results – Body Composition
The table below from the American Council on Exercise shows how average percentages differ according to the specified groups and categories:
| Female | Male | |
|---|---|---|
| Essential Fat | 10-13% | 2-5% |
| Athletes | 14-20% | 6-13% |
| Fitness | 21-24% | 14-17% |
| Average | 25-31% | 18-24% |
| Obese | 32%+ | 25%+ |
So, I’m towards the lower end of average at the moment, but should really be a lot lower.
It’s interesting to see how this compares to my body composition scales at home though. I have two sets of these that use bio-electrical impedance to measure body composition. I will be writing a review of the funky Wi-Fi enabled Withings WS-50 Scales soon, but with these scales set to ‘athlete mode’ they are currently flattering me with readings around 14% body fat. If set to non-athlete mode they read higher than this and I have to admit that my body itself isn’t really in athlete mode, so maybe they are more accurate than I thought.
Obviously the super-expensive DXA scanner is going to be much more accurate, but it’ll be interesting to see if I can get the readings from bio-electrical impedance scales to match the true readings from the DXA scan. Once I’ve had another DXA scan and therefore have another data point I’ll experiment with the settings on my scales to see how well they actually track any changes.
It’s all in the Hips Baby
The DXA Scan also focussed in on my hip bone, a common site of weakness in cyclists. My results here weren’t quite so good.
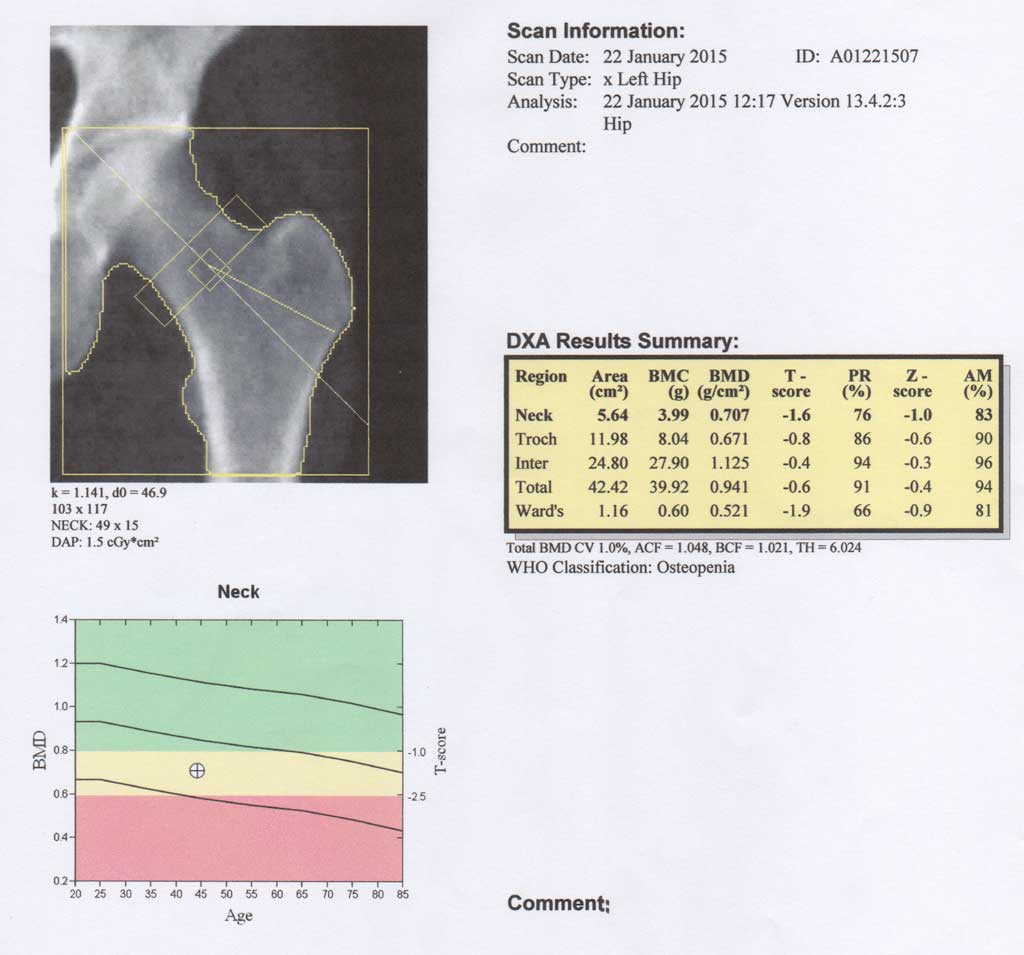
DXA Scan Results – Hip
The total figures for my hip were a BMD 0f 0.941g/cm2 and a T-score of -0.6. Both a little lower than my overall score but within the normal range. However, evidence suggests that the femur neck is the optimum site for predicting the risk of hip fracture. The scores here are not so good, with a BMD of 0.707g.cm2 and a T-score of -1.6 which puts me firmly in the osteopenia category. Just a quick note on the the “Ward’s” figures in my results. This refers to the region with the lowest BMD in my hip. Ward’s triangle is not a true anatomic area but is generated by the DXA scan as the area having the lowest BMD in the femoral head. The measurement of BMD in Ward’s triangle should not be used to diagnose osteoporosis. One should use the femoral neck BMD, trochanter BMD, or total hip BMD as determined by the DXA scan to diagnose osteoporosis. [Cummings et al, “Clinical Use of Bone Densitometry: Scientific Review” (JAMA. 2002;288:1889-1897)].
Weak Spine
Finally, we come to the DXA scan of my Lumbar Spine. This is another region of the body where cyclists often exhibit low bone mineral density readings. My results here aren’t so good.
For a start the student doing the scans commented on the fact that my spine itself was quite small. The results show the Area and Bone Mineral Content of each vertebra in my Lumber Spine. Without knowing what these should be for someone of my size these numbers don’t mean much to me, the BMD of 0.862 and a T-score of -2.1 aren’t great though. These put me towards the lower end of the osteopenia classification and not far off from being diagnosed as having osteoporosis. And, as you can see from the printout suggest that I have an increased risk of fracture.
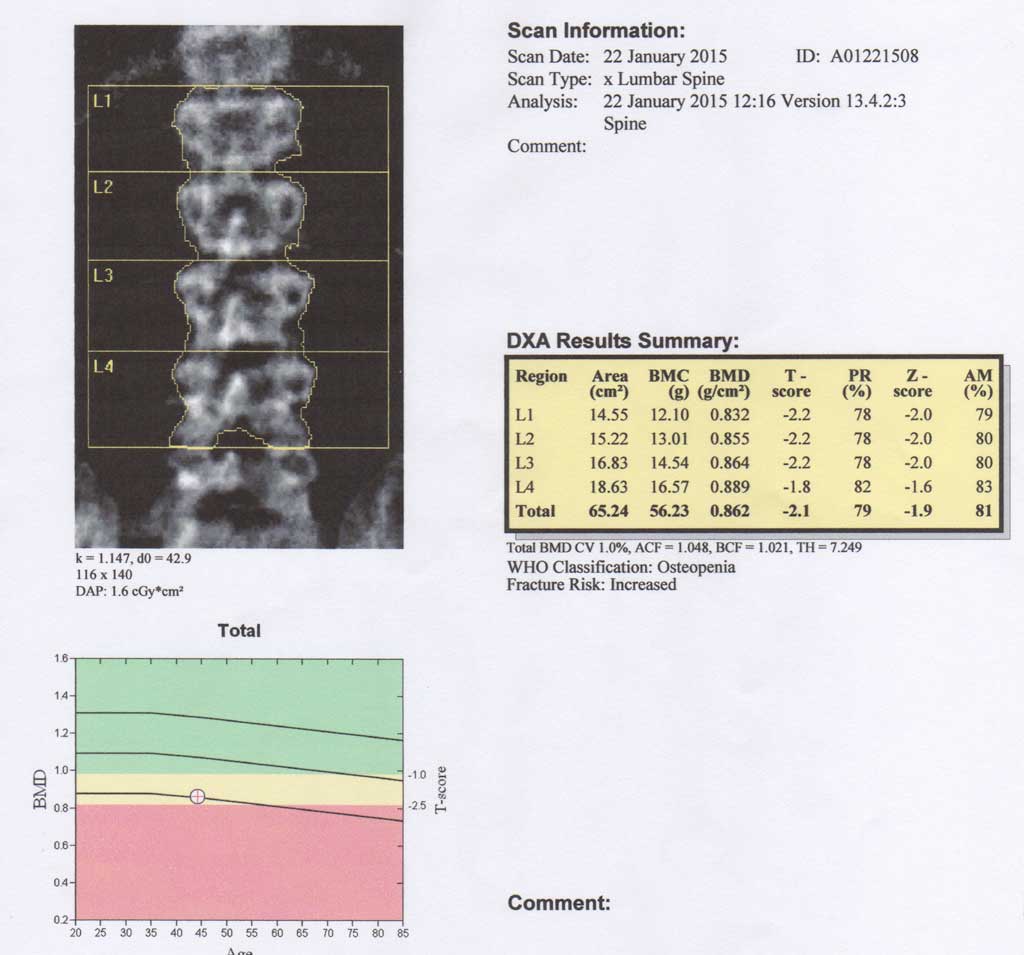
DXA Scan Results – Lumbar Spine
There may be a reason for this though. Many years ago, probably about 15 actually, I had an MRI scan to help diagnose some back problems that I was having. The results indicated that I had a couple of partially prolapsed disks, but also indicated that I had a ‘hidden’ form of spina bifida called spina bifidi occulta (Occulta is the latin for ‘hidden’). This is the mildest form of spina bifida in which the outer part of some of the vertebrae is not completely closed. The splits in the vertebrae are so small that the spinal cord does not protrude. Many people with this type of spina bifida do not even know they have it, as the condition is asymptomatic in most cases. However some studies have suggested that among patients with back pain, severity is worse if spina bifida occulta is present.
Oddly, 80% of those with a spinal cord problem will have a skin defect of the lower back such as:
- a hairy patch;
- a fatty lump;
- a hemangioma — a red or purple spot made up of blood vessels;
- a dark spot or a birth mark
- a skin tract (tunnel) or sinus — this can look like a deep dimple, especially if it’s too high (higher than the top of the buttocks crease), or if its bottom can’t be seen; and
- a hypopigmented spot — an area with less skin color.
I do indeed have a raised, hairy, dark birth mark (at least that’s what we’ve always called it) on my lower back.
I’m not sure what the relationships between spina bifida occulta and BMD / T-scores are, but it seems likely to me that there would be some relationship between them and this may well explain my low scores in this area.
Recommendations
Clearly this wasn’t a medical examination as it was part of a sports science study but it does lead to questions about what can be done to prevent the decline in BMD as we age. The answers here are the usual things:
- A good healthy diet high in vitamins and minerals, particularly vitamin D and calcium
- An active lifestyle with plenty of weight-bearing exercise
- Not smoking
- Not drinking alcohol
I think I have all the bases covered there, so there’s not much I can do about my low scores in certain areas. It’ll be interesting to see how the numbers compare next time I have a scan though.
2 Responses
Leave a Reply
Sponsors.
If you would like to sponsor me and get some positive exposure for your business at the same time, please get in touch or use the donate button below. I'll do my best to make it worth your while.I'm currently racing for Scimitar Sports Racing Team and Beet-it Sport


Interesting, but as you say there’s nothing more you can do and as you enjoy all the good things in life, carry on